
Hi all, I haven’t written anything for a long time due to various reasons. I’m now a happy Solutions Engineer at Grafana Labs working on solutions for our customers in the Monitoring and Observability space and I plan to publish more content regularly soon.
Meanwhile, I have created this short demo video of monitoring endpoints with Grafana using the Grafana stack, i.e., mostly Grafana Loki for managing logs and Grafana Tempo as an OpenTelemetry backend.
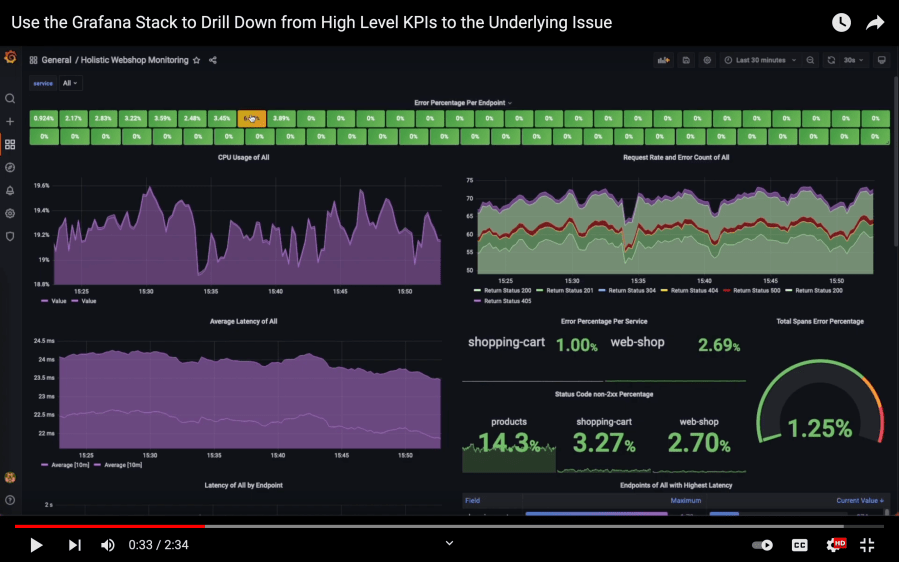
In this video you’ll see how to go from high level endpoint metrics, in this case the error rate of the endpoints of a demo web shop application, to a specific trace where an error occurs to the log line that shows what the error message is. Let me know if you have any questions.
