A Brief History of Data Security and Data Governance on Data Lakes

The initial idea of so-called data lakes was to be able to process, transform and dig through huge data sets of unstructured, semi-structured and structured data. It was fairly simple. You put your data set on a Hadoop Distributed File System cluster, you wrote one or multiple MapReduce jobs, which parallelised the processing steps to retrieve the results you were aiming for. Nowadays, it’s not that simple any more, since the number of data bases, tools and frameworks, which are supposed to make this work easier, but also more secure, grew rapidly. This article is a side product of a talk I gave for a Cloudera Foundation project and depicts the history of Data Security and Data Governance. I start in Wild West like scenarios, in which data lake security was neither an option nor a requirement and nobody actually talked about data governance yet. In the course of this article we walk through different epochs to the present describing state-of-the-art capabilities of data lakes for companies to make as sure as possible that neither their data lakes are being breached, nor Personally Identifiable Information (PII) is leaked. The epochs I’m describing are just like the real Stone Age, Bronze Age, Iron Age,… – very dependent on the location, some regions are further developed, some regions are slower but may skip eras. Hence, the estimated time windows are only vaguely defined.

Data Lake Stone Age (5-15 Years Ago)

In the beginning, a lot of companies had one or a few huge data sets for mostly one or a few single use cases. The only way of securing this data was a firewall to block users from having access to the cluster. If you had network access to the cluster, you had access to the data on the cluster. Or in other words: there was nothing else that prevented users from accessing the data anonymously, but the firewall. For some companies or departments, especially smaller ones, this was acceptable, it was fairly easy to implement and it was based on mutual trust between the stakeholders, the data owners and users of the data platform.

Trust as a Security Measurement is Simply Not Enough

This approach was a good – and the only – way to kick off the project “data lake”. As the number of data sets grew on the data lake, the number of stakeholders grew and suddenly – oh surprise – the concept of mutual trust as a security measurement began to fail. Not only was it impossible that all users would know each other so well, as to trust each other, two more risks are always introduced, when multiple people work together: human failure, and conflict of interests. It soon became a requirement to build “secure” data lakes.

I remember being at a data conference and I listened to a talk about data infrastructure. They explained all the fancy stuff they were doing, emphasised multi-tenancy and high flexibility and scalability and a few other buzzwords. At the end of the talk there was a question from the audience: “How do you do all of this with ‘Security enabled’?“. The answer: “Well, we don’t have ‘Security enabled’ on our data platform.” That was 2016.

Bronze Age: What does “Secure” Actually Mean? (4-10 Years Ago)

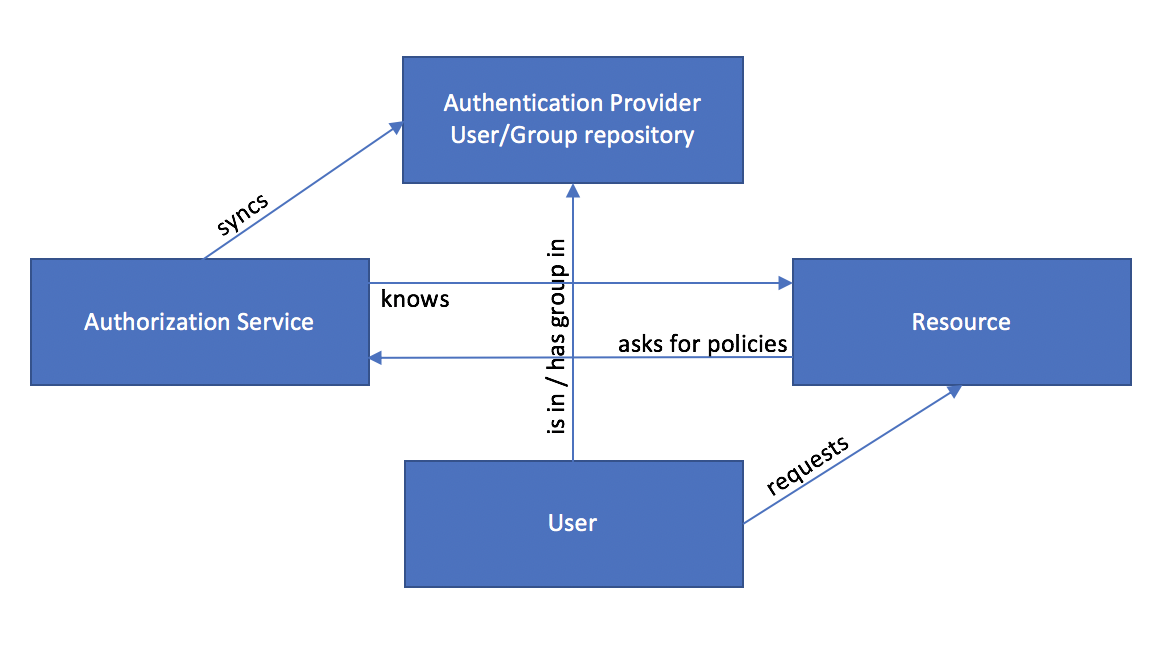
The basic idea of securing a cluster is to grant access of certain persons to certain data sets and restrict access to others. Almost every database technology comes with one or more ways to define policies that enable the administrator to define who can access which data set within this database. This is known as authorisation. The issue here is that you still need a mechanism to prove to the database system who you are. This is known as authentication. Usually this involves a username and a password to match. This sounds simple, but working on scalable, distributed systems this causes complex challenges that have been solved in different ways, one of the most wide-spread and at the same time oldest mechanisms leveraged to implement authentication on data lakes is the Kerberos protocol.

Becoming Compliant was Possible – Not Easy

At that time, we could authenticate ourselves and access data that we were authorised to use. So, what else did we actually need? Especially in – but not limited to – the financial services industry, it was always a requirement to keep an access log, answering the questions of who was reading data or writing data and when that happened. Most database systems can deliver on that. In the meantime, the world of (open source) databases and data storage engines got quite complex and manifold. There’s a data storage system for each use case you could possibly think of: Do you need to archive raw data at a cheap rate and keep it available for processing later? Do you want to do simple, yet low-latency lookups of certain key words and retrieve information associated with these? Do you want to be able to full-text search documents? Do you want to do SQL queries that are not time critical or rather implement real time dashboards? All of those use cases require your data to be stored in different database systems, sometimes the same data is stored multiple times differently in multiple different database systems following the so-called polyglot persistence architecture. All of those different systems have a way of authentication, authorisation and audit and all of them work similarly, but are more or less different. And exactly this makes it insanely complicated to administrate: they are many different systems with their own implementation of “Security”.

One Service to Secure them All – Problem Solved!?

Retrospectively, the next possible development was as necessary, as it is now obvious. We needed services that could administrate authorisation and collect audit logs in a single point. The development of tools, such as Apache Ranger and Apache Sentry was initiated. It was suddenly easier and more scalable to manage role based security access policies across multiple database systems, also referred to as role based access control (RBAC).

Iron Age: Why Data Lakes are not Necessarily Like Wines (1-6 Years Ago)

While security was one problem that seemed to be fixed, companies wanted to answer more questions about their data – especially because the risk of losing data or data in a data lake becoming worthless was imminent, if they didn’t. These questions were:

  • Where does my data come from? (Lineage)
  • What are the processing steps of the data I’m using?
  • Who owns the data I’m using?
  • Who is using the data I own?
  • What is the meaning of the data sets available in a data lake?

If you couldn’t answer these questions, while you were still on-boarding new data sources on a daily base and continuously granted data access to new people, you soon had a problem. You had a data swamp. [Play ominous music in the background while reading the last sentence].

data swamp is a deteriorated and unmanaged data lake that is either inaccessible to its intended users or is providing little value.

Wikipedia

Data Lakes are less like wines, that become better with age, but more like relationships, that become better if you take care of them. [At least that’s what people who have friends tell me].

The Toolset is Expanded and New Roles Emerge

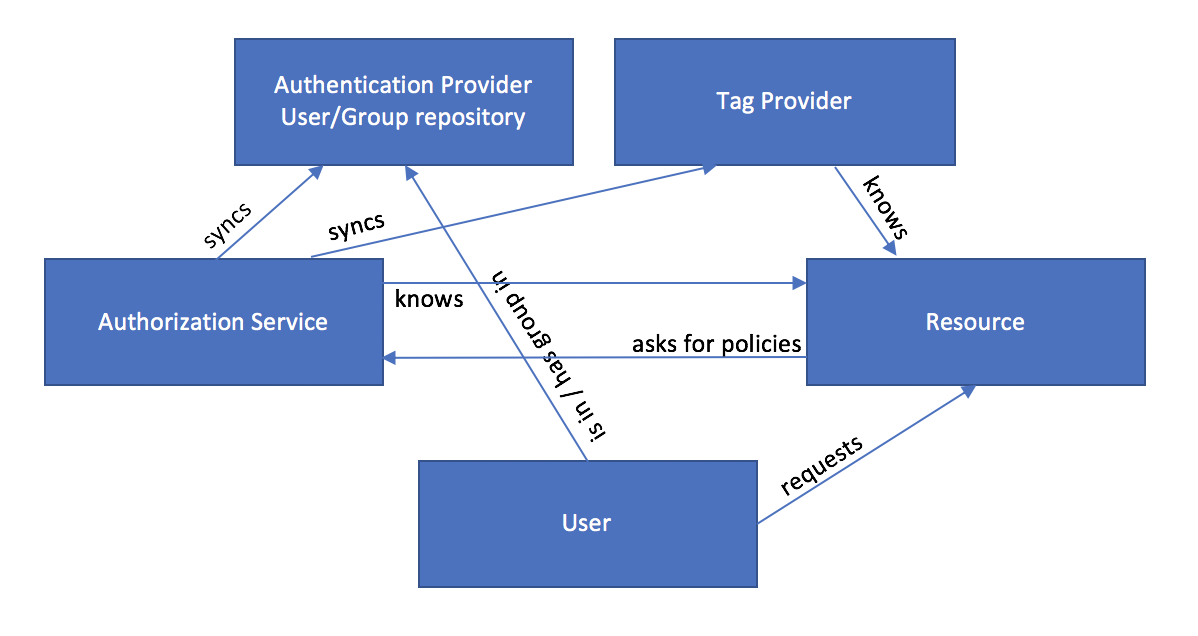
Similar to the Iron Age which is marked as the time when humans started to create superior tools made out of iron, the Iron Age for data lakes starts in your company, when you can answer the questions above efficiently, correctly and in a scalable way. Much as in the Iron Age, this requires appropriate tooling that hasn’t been there before. One of those tools emerging in the Open Source world was Apache Atlas. It started rudimentarily, but grew rapidly with the companies’ requirements. In the beginning you could tag data stored in a few data storage systems and display their linage. Later, the number of supported systems grew due to open standards and the meta data categories you could assign were expanded. A demand for a new role emerged, the data steward, a person, who is responsible to make sure meta data questions around a data lake can be answered at all times. Unfortunately, the name of the role sounds as boring as the role is important.

Next Level: Producing Steel in the Iron Age

After reading through a few of the previous paragraphs, I think you get the hang of it: The number of data sets grows again, the number of users grows again and as a result new problems emerge: we reached a point now, where it is simply painful to manage security policies and at the same time keep track of them. At this point there might be hundreds of policies per database, each policy matching a certain role/group with a certain data resource. This new challenge required new capabilities of a modern data platform and similar to the Habsburg success strategy “Tu felix Austria nube”, security and tagging capabilities were married. Henceforth, it was possible to create tag based policies, and thereby reducing the number of security policies by orders of magnitude.

One More Problem to Solve

An issue that hasn’t been discussed specifically in this article yet, but should be mentioned: encryption. There’s two types of encryption:

  • “Wire Encryption”: SSL/TLS encryption we face every day in our browser windows, when we visit a website with the prefix https – as opposed to http – “s for secure”. This is called wire encryption, encrypting the communication between two servers and I’m not going to explain here why this is important. This was done multiple time on the internet, e.g., here.
  • “Encryption at rest” describes data persisted in any storage system, e.g. a local hard drive, a distributed file system or any database system. Especially in times where you might not take care of your own infrastructure (data center, cloud vendor,….), encryption at rest makes sure, that those who administrate the infrastructure and possibly assign policies cannot actually use the data. The encryption key stays with the designated user or is managed on separate Key Management Servers (KMS) to guarantee that only those who are allowed to use the data (beyond policy assignment) can see the data.

Medieval Times: How to Deal with Regulations and External Policies (0-3 Years Ago)

One might ask themselves, why I would compare the time of regulations and governmental policies with the medieval times, often known as the dark ages. One good analogy is that, we have most of the required tools available from earlier times, but we are just not using them. And this is were the analogy ends already: the reasons of not leveraging technology in the medieval times were very different ones…

Let’s recapitulate what we have so far:

  • Growing number of data sets
  • Growing number of users
  • Polyglot persistence
  • A set of tools to address security challenges
  • A set of tools to address governance challenges

On top of this, new regulations such as the General Data Protection Regulation (GDPR) pose new challenges. An overly brief and overly simplified summary of what GDPR means for a data lake can be found below:

  • We need the consent to the processing of people’s personal data.
  • We need to fulfill contractual obligations with a data subject, i.e.,
    • provide information to the data subject in a concise, transparent, intelligible and easily accessible form,
    • delete any data subject related data on request.
  • We need to protect the vital interests of a data subject or another individual through
    • pseudonymisation or tokenisation,
    • keeping records of processing activities,
    • and securing of personal data.

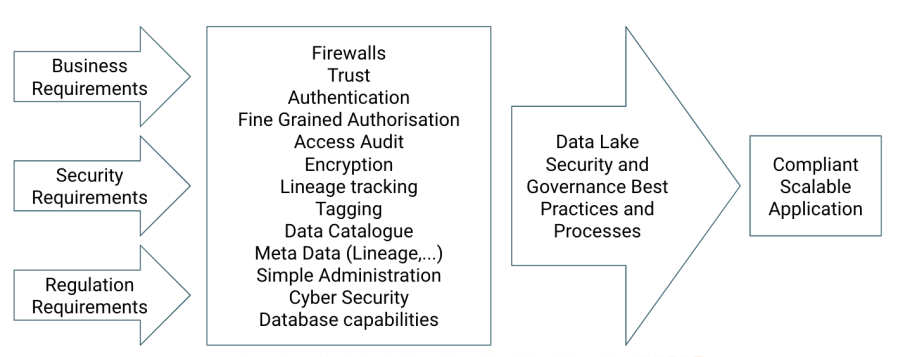
A solution to this is, on the one hand following best practices as well as establishing processes on the data lake using the existing tools. On the other hand, the solution is very individual. Similar to designing a data application based on certain business requirements, we need to make security and privacy considerations specific for this use case part of these requirements. Example: if a certain data set contains PII that could possibly be presented to the outside, we have multiple options. For example, we could use a storage engine that supports tokenisation of certain fields of PII. If the storage we need to use to deliver our use case requirements does not support tokenisation, then we would need to make sure to tokenise, anonymise or encrypt those fields at the time of data ingestion. If,… – I hope you get the idea. It’s important to look closely into your requirements and then carefully architect a solution based on the capabilities of the data platform and the processes you put in place.

Best Practices to Become and Stay Compliant

Above mentioned best practices and processes can be summarised as:

  • Establish processes to manage
    • consent,
    • transparency and intended usage,
    • automatic processing of personal data.
  • Leverage dynamic masking and access control: use roles, tags, location and time to restrict access.
  • Use the tools and its capabilities mentioned in this article efficiently.
  • Become a user and customer-centric organisation: Design your applications with your customers as your most important asset. This makes it easier for you to manage and delete customer related data (and to make your customers happy as a side effect).

Renaissance: No System is 100% Secure (0-2 Years Ago)

This article focused on how to prevent data breaches and make it as difficult as possible for people with malicious intent to get access to data they shouldn’t have. However, what can go wrong will go wrong and even if we try our best, we are still human beings. We all do mistakes and since (personal) data is highly valuable, which is the main reason we take so many different measurements in the first place, there will always be people who want to get this data to use and abuse it. There’s no system yet to protect us from social engineering and data breaches happen on a regular base. In addition to that, the “Internet of Things” (IoT) adds a higher attack surface (= number of possibilities to enter a system without permission) than ever before.

Therefore, it’s mandatory to work closely with our cyber security colleagues to be able to detect breaches and respond to them as soon as possible as well as to have a good backup and disaster recovery plan. Modern data lakes are commonly built using the very same technology that powers their business use cases to also power their cyber security and threat hunting efforts.

I’ve worked quite a bit with Apache Metron, a cyber security platform running on a data lake. and written quite a bit about it on this blog.

The Future: New Regulations and Governmental Policies and Technology

The number of governmental regulations will grow in the future and they will be very specific to specific countries. Some kind of data is not allowed to leave certain countries. Some kind of data will always be inspected by certain governments, when it leaves the country. New and additional data privacy and governance regulations will be published as the existing ones are being tested in the wild. More requirements always means more complexity. This shouldn’t worry you, since you know your data platform and it’s databases, it’s security capabilities, as well as it’s data governance capabilities. Furthermore, you have well educated data architects and engineers who not only know how to translate business requirements into a data architecture, but also security requirements and governance requirements of internal and external regulations and policies into the same data architecture.

Framework to overcome security and data governance challenges.

I’m also pretty sure, that there will be regulations that will bring challenges that will be difficult to overcome – if not impossible at that time. The beautiful thing is that all companies (that are affected by this regulation) will face this challenge and they might find their specific ways to overcome those challenges, or – and that’s what happened multiple times in the past – companies work together on open source software to overcome those challenges together.

I Barely Used the Word “Cloud” in this Article! What’s Wrong with me?

Cloud is just one (major) option to store and process the data and provides challenges as well as opportunities. Your cloud provider of choice might not have a data center in the country you produce the data (= challenge). You might not have a data center in the country you produce the data, but the cloud provider has (= opportunity). Basically, treat cloud as part of your tool set to solve challenges and use it as you would use every tool, knowing that it has advantages and drawbacks.

Outlook

This article described roughly the history of security and data governance of data lakes (as far as you can put those items on a strict timeline). Each of those historic additions to the data lake security and governance ecosystem are essential building blocks and tools and all of them are still as relevant as at the time of their introduction. It’s up to you to put them to use and leverage all of their capabilities to make your life easier and your data more secure, manageable and compliant.

The Concepts of Tag-Based Authorization

What is classical authorization?

The answer to this question is resource based authorisation. Everybody is familiar with resource based authorization. It’s about managing a set of policies for all resources, i.e., databases, tables, views, columns, processes, applications and others. That means whenever you create a new resource, you need to create a new policy that matches this resources with users or groups and assigns adequate permissions to them.

In resource-based authorization security policies match resources with users/groups.

Thus, authorization services must be aware of the resources (from a specific resource providing service) as well as users and groups (usually from an authentication provider, such as an Active Directory).

The Process

The authorization service connects to the resource-providing service to be aware of the resources. The service typically knows which types of permission the specific resources allow for. In the diagram below you see a simplified process of how resource based authorization typically works and how the “stakeholders” interact.

Typical components and interactions involved in resource based authorization

In the Big Data landscape the de-facto standard authorization service is Apache Ranger.

Tag Based Authorization

Tag-based authorization is not so much more different. Instead of having a set of policies that match resources with users/groups, you create a set of policies that match tags with users/groups. This means also, that you need another instance or service to match resources with tags. Now, whenever you create a new resource, the only thing you need to do is to tag it. All existing policies for that tag will automatically apply for the new resource. This gives you more flexibility if you have a complex authorization model in your company, because one tag might be connected with multiple security policies:

  • It saves you from duplicating the same policies from similar resources
  • It’s more user-friendly and comes more natural to assign tags to a resource than thinking about which permissions/policies might be required, everytime you add a new resource.

In tag-based authorization security policies match tags with users/groups.

The Process

As mentioned before, an additional service is needed to manage the relationship between resources and tags. The authorization service knows the resource, syncs user and groups as well as the tags for the resources. The tag provider knows the resource and is the interface for the user to assign tags to the resource.

Typical components and interactions involved in tag-based authorization.

You can manage tags and govern your data sources using Apache Atlas. Apache Atlas integrates well with Apache Ranger and other services in the Big Data Landscape and can be integrated with any tool by leveraging its REST API.

Create Useful Tags

Tagging is powerful, since you can look from different angles at your resources, i.e., you can introduce multiple dimensions. Once you decided to go with tag-based security, the first step is to think about which dimensions you want to introduce in the beginning. The second step is to consistently apply those dimensions across your resources.

You can think of dimensions as categories of tags:

  • One category of tags classifies a resource, e.g., a database based on the source system the data came from: MySQL, Server Log, HBase, …
  • Another category of tags introduces the dimension of use cases: cyber_security, customer_journey, marketing_campaign2, …
  • A third category might be the career level within a company: common, manager, executive
  • Another category of tags distinguishes departments: sales, engineering, marketing, …

As long as you are consequently tagging your resources appropriately, the advantages of tagging in the context of authorization are immediately apparent: When you create a new resource, for example a Hive table, you apply the tags MySQL, customer_journey, executive, marketing and based on the pre-defined tag-based policies you’ll know that

  • The technical user, that does the hourly load from the MySQL database to Hive has write access to the table.
  • The team of all people that work on the customer journey project has read access to the table.
  • All employees on the executive level have read access to the table.
  • The marketing department has full access to the table.

Conclusions

I hope this article made it easy to understand the process and benefits of tag-based authorization. However, simplified security is only one of the benefits of tagging. Tagging is also useful to describe lineage and thus facilitate data governance.

4 Essential Stellar Core Functions to Do Enrichments in Apache Metron

Apache Metron processes telemetry event by event in real time. Each type of event comes with its specific set of fields. E.g., a proxy log will always contain a source and a destination IP address. A log-on event will always contain a username of the person who wanted to log on. Adding fields to this set of fields in the processing pipeline from other data sources is called an enrichment. Metron offers multiple ways to enrich your telemetry.

This blog entry focusses on enrichments performed with Metron’s scripting language Stellar and shows the usage of 4 useful functions.

Types of Enrichments

First, let’s have a look at the Metron Enrichments documentation. You’ll find that there are multiple types of enrichments: geo, host, hbaseEnrichmentand stellar. As mentioned, we’ll discuss only stellar enrichments here, which is a powerful scripting language to get data from various sources and transform it to make it suitable for our use cases.

Before we start: as with every modern data app, always keep the use case in mind. Enrich and transform your data because it really makes your life easier and your job more fun (and provides some business value ;-)). If you do it because it’s just nice to have or just because it’s possible, you are wasting time to implement it, as well as computing power.

The Functions

ENRICHMENT_GET

ENRICHMENT_GET: Similarly to the hbaseEnrichment, which does a simple HBase look-up of the column family “t” on the “enrichments” table, you can do HBase look-ups. However, with ENRICHMENT_GET you can specify which table and column family to use for the lookup.

An ENRICHMENT_GET call made up of 4 string arguments looks like: ENRICHMENT_GET('userinfo', 'myuserid', 'mytable', 'mycf'). This performs a “get” query to the HBase table mytable using the composite key of userinfo and myuserid to retrieve all values stored in the columns of the column familiy mycf. All function arguments can be replaced by variables. This implies that you could use a different table, column family and key for each event even within a single data source based on derived values of each event. However, in reality, the most common (and maintainable and predictable) scenario is, to only use the second parameter as a variable and keep the other arguments constant for a certain parser and scenario.

Let’s have a look at a detailed example: Assume, we have onboarded a static enrichment source in HBase called userinfo using the HBase table static_enrichments and the column family s. For each user with a certain ID we have stored the following data:

row keystatic_enrichments:s
userinfo axc12345{"userid": "axc12345", "firstname": "Max", "lastname": "Power", "employee_status": "active"}
userinfo brt98764{"userid": "brt98764", "firstname": "Sara", "lastname": "Great", "employee_status": "retired"}

The Stellar expression below

userid := 'brt98764'
userinfo := ENRICHMENT_GET('userinfo', userid, 'static_enrichments', 's')

extracts a map with the following values

userinfo:

{
"firstname": "Sara"
"lastname": "Great"
"employee_status": "retired"
}

This map will be indexed to Elastic Search or Solr as

userinfo:firstname           --> Sara
userinfo:lastname --> Great
userinfo:employee_status --> retired

If you wanted to manipulate those values directly in a Metron workflow, e.g., to evaluate the employee status, you need to extract the value using the MAP_GET function.

MAP_GET

This function should be used to extract the value of a field from a map, e.g., from a map obtained from a HBase enrichment. In Stellar you could do

userinfo:employee_status := MAP_GET(userinfo, 'employee_status')

This assigns the value of the employee_status field of the userinfo map to the variable userinfo:employee_status. You can now use the employee status of the current user for further evaluations, e.g. to check if they are active.

is_active_user := userinfo:employee_status == 'active'

This will create a flag is_active_user as a new field that will be indexed. You can use this flag to define alerts and do scoring in Metron. In Elastic/Solr you can filter for active users using this boolean flag.

TO_LOWER/TO_UPPER

For comparisons TO_LOWER and TO_UPPER are essential. Before doing an enrichment converting one of our example usernames from AXC12345 to axc12345 will ensure that the lookup to HBase is successful

userid := TO_LOWER(userid)
userinfo := ENRICHMENT_GET('userinfo', userid, 'static_enrichments', 's')

There are many other useful string functions, to split, join or do other operations on strings. Go check them out.

ENRICHMENT_EXISTS

Sometimes you don’t want to add a ton of new fields to be indexed or you don’t even need all of the fields. You rather want to check if there *is* an enrichment at all. This can be used for blacklisting or whitelisting. Imagine you have an enrichment that looks somewhat like this, a HBase table whitelist, a column family b and an enrichment type domains.

keywhitelist:b
domains example.com{“domain”: “example.com”}
domains anotherexample.com{“domain”: “anotherexample.com”}

You see, that this table does not even contain useful additional information. You only want to check if a certain domain is blacklisted/whitelisted, like so:

mydomain := 'example.com'
is_blacklisted := ENRICHMENT_EXISTS('domains', mydomain, 'whitelist', 'b')

Above example will yield true for is_blacklisted an can later be used in threat intel logic and score assignment. It is also indexed to Solr/Elastic Search automatically.

Conclusion

Using Apache Metron, you can do powerful real-time enrichments for all kinds of use cases. Stellar is a powerful tool within Metron to help you do complex enrichments, manipulations and transformations in a simple way. There are many more functions. The four functions introduced in this blog entry are very commonly used when you do enrichments.

A Cookiecutter for Metron Sensors

What is “Cookiecutter”? Cookiecutter is a project that helps create boiler plate and project structures and is very famous and widely used in both the Python and data scientist communities. But you can use Cookiecutter for virtually anything, also for Apache Metron sensors.
Apache Metron is,…. well read some of the earlier blog posts, or the documentation. 🙂

What is the cookiecutter-metron-sensor Project?

The cookiecutter-metron-sensor project helps you to create sensor configuration files and it generates deployment instructions and a corresponding deployment script for the specific sensor. If you need all the details check out the README.md of the project on github:

https://github.com/Condla/cookiecutter-metron-sensor

Usage

To use the Metron sensor cookiecutter you only need one thing installed: cookiecutter:

pip install cookiecutter

Then you need to clone the project mentioned above and run the template. That’s it.

git clone https://github.com/Condla/cookiecutter-metron-sensor
cookiecutter cookiecutter-metron-sensor

Now simply fill in the prompts to configure the cookiecutter and the lion’s share of the work you need do to onboard a new data source is done. In the directory created you find a deployment script as well as another README.md file that you can use to document everything around your sensor as you go ahead and define your own transformations and enrichments. The README.md comes with the deployment instructions for its own specific parser.

Help to fill in the Cookiecutter prompts

While the cookiecutter-metron-sensor helps you to create and complete all of the Metron sensor configuration files, it does not do anything to explain what those prompts mean. You still need to read the documentation for this. However, to assist you in your efforts I’ll walk you through the configuration prompts and point you to the documentation, so you understand what and why you need to configure it.

  • sensor_name: This will be the name of the sensor in the Metron Management UI and determines the name of the parser Storm topology and the name of the Kafka consumer group.
  • index_name: The name Metron will use to store the result of the Metron processing pipeline in HDFS, Elastic Search or Apache Solr.
  • kafka_topic_name: This is the name of the Kafka topic the sensor parser will subscribe to.
  • kafka_number_partitions: The number of partitions of the Kafka topic above. It also determines the number of “ackers” and Storm “spouts” of the sensor parser topology. If you’re not sure it’s good to start with 2 and increase this number later on, if you see that the parser topology builds up lag. Check the Metron performance tuning guide for more information.
  • kafka_number_replicas: The number of replicas of the above Kafka topic. For data security and service availability reasons this should be 2 or 3.
  • storm_number_of_workers: The number of Storm workers you want to launch for the sensor parser topology. Each worker is it’s own JVM Linux process with memory assigned to it. All Storm processing units will be distributed over these workers. For availability reasons use 2 or more workers.
  • storm_parser_parallelism: This will affect how fast the sensor parser will be processing the incoming data stream. Per default cookiecutter sets it to your choice of kafka_number_partitions which as mentioned above affect the number of processing units reading the stream from Apache Kafka.
  • batch_indexing_size: This is the batch size written to HDFS per writer and should be determined based on the parallelism and the number of events per second your are dealing with. Again, refer to the performance tuning guide.
  • ra_indexing_size: Similar to batch_indexing_size, but for indexing to Elastic Search or Solr.
  • write_to_hdfs: Select true if you want to use the batch indexing capabilities to HDFS.
  • write_to_elastic_search: Select true if you want to use the random access indexing capabilities to Elastic Search.
  • write_to_solr: Select true if you want to use the random access indexing capabilities to Apache Solr.
  • write_to_hbase: Choose false if you want a “common” Metron pipeline [Parsing/Transforming] –> [Enrichment] –> [Indexing] –> [HDFS/Elastic/Solr]. Choose true if you want to onboard a stream ingest enrichment source [Parsing/Transforming] –> [HBase].
    shew_table: The HBase table name you want to write to in case you use write_to_hbase. You can ignore this and use the defaults in case you don’t.
    shew_cf: The HBase column family name you want to write to in case you write_to_hbase. You can ignore this and use the defaults in case you don’t.
    shew_key_columns: The name of the field you want to act as the lookup-key for you enrichment source in case you write_to_hbase. You can ignore this and use the defaults in case you don’t.
    shew_enrichment_type: The name of the enrichment to uniquely identify this, when you want to use this enrichment. It will be part of the lookup-key. Only important in case you write_to_hbase. You can ignore this and use the defaults in case you don’t.
  • parser_class_name: Select one of the possible parsers. Note: As all of these values, you can change that later in the Metron Management UI if you are using a custom parser or can’t find you parser in this list.
  • grok_pattern_label: Per default this is the sensor_name in upper case letters, but you might want to change this.
  • zookeeper_quorum: This is important for the deployment script so you can create a Kafka topic. If you deployed Metron using Ambari you’ll find this information in the Ambari UI.
  • elastic_user: Important for the deployment. If your Elastic Server does not use the X-Pack for security you can leave this field empty.
  • elastic_master: The URL to the Elastic Search Master server
  • metron_user: An admin user that has access to the Metron REST server
  • metron_rest: The URL to the Metron REST server.

Note: This cookiecutter-metron-sensor project is very young and work in progress to continuously add new features with time with the aim to make it even easier for a cyber security operator to master threat intelligence data flows.

Apache Metron Architecture

In one of my previous articles I wrote about Apache Metron as an Example for a Real-Time Streaming Pipeline. Since then, I’ve refined the figure I’ve used to explain the architecture. In this article, I just briefly explain the updated part of the figure and add a video of myself talking about Apache Metron at the Openslava conference in Bratislava using those updated figures in my slides.

Enrichment


I added a few more details into the figure on the enrichment part:

  • The enrichment Storm topology is capable of using external database sources on-boarded into HBase or from the Model as a Service (MaaS) capability.
  • The arrow from the enrichments Kafka topic is not entirely correct, but should depict that data sources coming in in real-time can be stored in HBase as an enrichment source. Correct would be to draw the arrow to HBase directly from the parser topology.
  • Huge data sets can be fairly easily batch loaded into HBase as an enrichment source.
  • The profiler is a Storm topology that saves data of certain (user-defined) entities in a time series to HBase. From there it can be used as an enrichment for any future events as aggregates over time.

Open Source Cyber Security with Apache Metron @ Openslava2018

How to Define Elastic Search Templates for Apache Metron

When you onboard a new data source on Apache Metron and you use Elastic Search (ES) as your indexing + search engine you need to specify and submit an ES template before the indexing topology attempts the first write to the ES cluster.

The template should contain the following items:

  • Dynamic fields for possible geo enrichments of any ip address field,
  • dynamic fields for other kinds of enrichments
  • well defined static fields (“properties”) based on the fields that are unique to this parser.
  • As found in the official Metron docs: The metron_alert field type needs to be nested. As per the documentation, if you forget to do this, you’ll run into this Exception:
QueryParsingException[[nested] failed to find nested object under path [metron_alert]];

Use the Elastic Search Reference Manual to get familiar which data types Elastic Search offers and how to use them!

How to Create an Elastic Search Template for an Apache Metron Parser

An efficient way to create your own template is to get an existing one that comes with Apache Metron, adapt it and use it to create your own.

  • Step 1: Obtain an existing template, e.g., the yaf_index:
export ELASTICSEARCH_MASTER=condla0.field.hortonworks.com:9200
curl -X GET $ELASTICSEARCH_MASTER/_template/
curl -X GET $ELASTICSEARCH_MASTER/_template/yaf_index | python -m json.tool > template.json
  • Step 2: Modify it to your needs. Assume we are creating a squid template
    • Remove the outer most json layer. The "template" key must be on the top level.
    • Rename any “yaf” fields to “squid” fields.
    • Refer to the list in the beginning of this blog entry to get an idea what else you need to modify.
    • A working squid template can be found here.
    • Note that you can find a set of fields that all data sources should have in common:
      • timestamp
      • guid
      • source:type
      • ip_dst_addr
      • ip_src_addr
      • ip_dst_port
      • ip_src_port
    • as well as a set of fields unique to squid:
      • action
      • bytes
      • code
      • elapsed
      • method
      • url
vi template.json
{
  "template": "squid_index",
  "mappings": {
    "squid_doc": {
       "dynamic_templates": [
       ...
       ]
       "properties": {
       ...
       }
    }
  }
}
  • Step 3: Submit the new template:
curl -X POST $ELASTICSEARCH_MASTER/_template/squid_index -d @template.json
  • Step 4: Check if template was created correctly
curl -X GET $ELASTICSEARCH_MASTER/_template | python -m json.tool

You can find a basic, fully working squid template here.

Troubleshooting

If you query a collection via the Kibana Metron UI and see an error similar to the following exception in the Elastic Search Master log, your template is either not valid or the index is not using it.

Caused by: java.lang.IllegalArgumentException: Fielddata is disabled on text fields by default. Set fielddata=true on [source:type] in order to load fielddata in memory by uninverting the inverted index. Note that this can however use significant memory. Alternatively use a keyword field instead.

 Thus, after you created the template and after you ingested your first events via the random access indexing topology, you want to check if your (rollover) index was created with the correct template:

# check if our squid index is there:
curl -X GET $ELASTICSEARCH_MASTER/_cat/indices
## example output:
## yellow open squid_index_2018.11.26.23 l7BO0FflRg6H0op3fM5wkw 5 1  5  0  48.3kb  48.3kb
## yellow open .kibana                   sEGp3YyZSXu40A1nRv1umQ 1 1 46 41 207.4kb 207.4kb

# check in the logs if there is a line that specifies which template was used when the index was created:
tail -f /var/log/elasticsearch/metron.log
## example output:
## ...
## [2018-11-26T23:13:58,395][INFO][o.e.c.m.MetaDataCreateIndexService][condla0.field.hortonworks.com] [squid_index_2018.11.26.23] creating index, cause [auto(bulk api)], templates [squid_index], shards [5]/[1], mappings [squid_doc]
## ...

Important Things to Note

  • /var/log/elasticsearch/metron.log is the most important log file for debugging ES template related actions
  • If you want to make your new data source available in Kibana, don’t forget to add the index pattern – in our case "squid_index_*":
    • Kibana: Management –> Create Index Pattern

How to Create a New Parser for Apache Metron

This blog entry goes through the process of a Cyber Platform Operator creating a new parser for Apache Metron and everything you need to consider to make this process as smooth as possible. This can also be seen as a checklist or to-do list when you are creating a new parser.

Assumption: You know what Metron is, the data source is fully onboarded on your platform and the parser config is the only thing that’s missing. Here are the things you need to consider to onboard a new source.

In general, this article walks you through 3 phases:

  • Check if you can re-use an existing parser. If so, you’re done, the testing part of phase 2 still applies, though.
  • Build and test a protoype. Grok is your friend.
  • Write your parser in Java.

Phase 1: Check if you can use an existing parser

  • Get a sample set of your source to test with. The more diverse you expect the formats of the same source to be, the bigger your sample size should be. 20 should be ok to start with.
  • Check the format of the string.
    • If it is in JSON format, use the JSON parser!
    • If it’s a comma separated line, use the CSV parser!
    • Or generally: If it’s in a format of any of the included Metron parsers, use this parser: CEF, Lancope, PaloAltoFirewall, Sourcefire, Logstash, FireEye, Asa, Snort, JSONMap, Ise, GrokWebSphere, Bro,….
    • If it’s something else use the Grok parser!

Phase 2: Build and test a (Grok) prototype

In the rest of the article I assume that you don’t re-use one of the included parsers, which is why you want to create your own custom one. Thus, you leverage the Grok parser. However, the test setup described below and can be used for any kind of parser.

  • Use http://grokdebug.herokuapp.com/ to test one of your samples and start with adding  %{GREEDYDATA:message} and continuously add more precise parsing statements and check if it compiles. If you’re new to Grok start here: https://logz.io/blog/logstash-grok/.
  • Test all of your samples in the app to check if your Grok statement is general enough.
  • You also might want to append %{GREEDYDATA:suffix}(\n|\r|\r\n)?+ to catch any kind of additional data, as well as filter newline and optional carriage-return fields at the end of a line. That depends on how diverse or clean your data source is.
  • Configure and validate the parser in Metron Management UI using “Grok” as parser type and paste the grok statement in the field “Grok Statement”.
    • Attention: don’t forget to define the timestampField, the timeFields and the dateFormat. If you don’t specify those values, the parser validation will fail with an “error_type”: “parser_invalid”. The field configured as the timestampField will be converted into a timestamp parsed based on the inputs from the dateFormat field. Use the Joda time date format documented here.
    • When the datetime is correctly parsed, double-check if the calculated timestamp matches the input time. This online epochconverter comes handy.
    • Note: to consolidate your view of the data across many sources, make sure you name the source ip address “ip_src_addr”, your destination ip address “ip_dst_addr”, your source port “ip_src_port” and your destination port “ip_dst_port”.
    • Note: In general, every parser – not only the Grok parser – has their specific required/default parameters to be set. Read the parser docs to be sure to configure the parsers correctly. Below is an example of how the parserConfig part of your parser configuration file should look like. You configure this part in the Metron Management UI:
metron_managementui_parser.png
  • Double check:
    • If Grok statements are stored in the configured HDFS path: /apps/metron/patterns/mycustomparser
    • If the Zookeeper configuration is up to date: bin/zkCli.sh -server <zookeeper-quorum> get /metron/topology/parsers/mycustomparser.  Specifically look for the parserConfig part shown below.
{
  ...
  "parserClassName": "org.apache.metron.parsers.GrokParser",
  "parserConfig": {
    "grokPath": "/apps/metron/patterns/mycustomparser",
    "patternLabel": "MYCUSTOMPARSER",
    "timestampField": "datetime",
    "timeFields": ["datetime"],
    "dateFormat": "yyyy-MM-dd HH-mm-ss",
    "timezone": "UTC"
  },
  ...
}
metron_parser_test_setup.png
Metron parser test setup: 1. Consume from the parser topic (assuming you initially ingested your sample already) 2. Control your flow rate to release only 1 event per 5 seconds (or which ever speed you like) 3. Write back into the parser topic and check if the event is being processed correctly.
  • Ingest the messages into the Kafka topic using your NiFi test setup and check if they are successfully persisted in your desired collection.

Phase 3: Make your Metron parser production ready

Once you have your custom parser up and running and improved it continuously you want to create something more stable with higher performance than Grok statements. However, nothing is for free. You need to get your hands dirty in Java. Fortunately, it’s not a lot of dirt and it’s quite easy to write your own parser by extending the BasicParser class.

  • Check out this part of the documentation to get a walkthrough: 3rd party parsers
  • In this part of the documentation you’ll learn to:
    • Get to know which dependencies you need.
    • Implement a parser method of your custom parser class extending the BasicParser class.
    • Build the jar and deploy it in the extra-parser directory.
    • Restart Metron Rest service to pick up the new parser from your jar file.
    • Add your parser in the Metron Management UI by choosing your parser type.
    • Configure and start your parser.
  • Stop your interim Grok parser and start your custom Java parser.

Apache Metron as an Example for a Real Time Data Processing Pipeline

In my previous blog post I was writing a little bit about what Apache Metron is and How to Onboard a New Data Source in Apache Metron.

Now I want to shine some light on how the ingestion pipeline architecture looks like. Since I just got started with Apache Metron myself, I hope this helps to kickstart your cyber security efforts. Rather than going too much into the details of what the components do, I’d like to provide a basic overview about which components there are.

This architecture can be generalized for all kinds of streaming use cases. The pipeline uses Apache NiFi for ingest, Apache Kafka as an event buffer, Apache Storm for stream processing, Apache Hadoop for long term storage and Apache Solr for short term random access storage. If you design your own pipeline for a different use case, you can, e.g., swap Apache Storm with frameworks such as Apache Flink or Spark Streaming (or any other frameworks out in the wild with their pros and cons). Choosing the right piece of technology strongly depends on numerous factors, I’m not going into in this article.

metron_pipeline
End to End Processing Pipeline for Apache Metron

Ingest

The most important part for Apache Metron is to get the telemetry data into an Apache Kafka topic. In the figure below you can see that there is a Kafka topic and a corresponding parser for each format. Usually, there is one Kafka topic per source type, because each source typically comes in its own special format, but it’s also possible that data of one source has multiple formats or multiple sources have the same format.

metron_pipeline_ingest_closeup.png
  • Apache NiFi is being used as the data integration tool.
  • In the figure, I added an example of a MiNiFi instance to the Squid Access Log source. In this case MiNiFi is installed on the Squid server node and acts as a log forwarder.
  • It’s also possible that sources write directly into Kafka, if they support that. In some cases this might even be a requirement due to performance constraints.

Parsing

As described in the ingest part: there is a topic for each parser format and an Apache Storm topology reading from this Kafka topic and doing the parsing. A parsed event is then written into the so-called “enrichments” topic.

metron_pipeline_parsing_closeup
  • The parsing has two purposes:
    • it brings all ingest format into a JSON format.
    • it introduces a common set of fields shared among all data sources, as well as unique fields that are special to each source.
  • Some parsers of common formats are included in the Metron project.
  • If there is no parser (that works) for your format, you can use Grok to quickly prototype and launch your parser before you write it in Java.
  • It is also possible to launch parser chains to extract information that is convoluted in different formats.
  • You can also decide to run only one topology handling multiple parsers in a so-called aggregated parser. This can be combined with parser chains.

Enrichment

The purpose of the enrichment Storm topology is to pick up events from the enrichments topic and add information from external sources. The enriched output is written to an indexing topic.

metron_pipeline_enrichment_closeup
  • A typical enrichment is a lookup in a database to convert an IP address into geo information
  • The profiler uses sliding windows to create aggregates/statistics in certain time windows, so-called profiles.
  • These profiles can be used to enrich data.
  • Metron helps you use any data in HBase to enrich your events.

Persisting

There are two Storm topologies to read from the indexing topic that persist events, the batch indexing topology and the random access indexing topology. The first utilizes an HDFSBolt to write data to HDFS. The latter one indexes data in Apache Solr.

metron_pipeline_persisting_closeup
  • There is one Solr collection per data format.
    • This way the parsed fields and definitions are kept clean and separated.
    • Also, you can authorize different users and groups to different data sources. This is even easier with the Solr Plugin for Apache Ranger.
  • HDFS is used as long term storage for analytical purposes and to use the data to create machine learning models.
  • Solr is being used for direct fast random access and search capabilities, e.g. by the Metron Alerts UI. It makes sense to store the data for only a limited amount of time for performance reasons.
  • It’s quite easy to create a new collection. I’ve described it on this github gist. I’ve added properties in the solrconfig.xml to define a “time to live” for an event in Solr, after which the event will be deleted from the collection.
  • Instead of Solr, you can use Elastic Search.

Conclusion

I hope this can be useful for somebody, either trying to implement Metron or somebody interested in how modern streaming pipelines look like in general. If you have questions, don’t hesitate to ask the experts in the Metron mailing list (user@metron.apache.org) or get support from the Hortonworks Community.

How to Onboard a New Data Source in Apache Metron

Introduction

Apache Metron aims to be a tool for analysts in a cyber security team to help them defining intelligent alerts, detecting threats and work on them in real-time. This is the first blog post in a row to ease operations and share my experiences with Apache Metron. Thus, it serves as an introduction to Metron.

Technical Introduction

Apache Metron is a cyber security platform making heavy use of the Hadoop Ecosystem to create a scalable and available solution. It utilizes Apache Storm and Apache Kafka to parse, enrich, profile, and eventually index data from telemetry sources, such as network traffic, firewall logs, or application logs in real-time. Apache Solr or Elastic Search are used for random access searches, while Apache Hadoop HDFS is used for long term and analytical storage. It comes with its own scripting language “Stellar” to query, transform and enrich data. A security operator/analyst uses the Metron Management UI to configure and manage input sources as well the Metron Alerts UI to search, filter and group events.

Screen Shot 2018-07-18 at 08.07.45
Metron Alerts UI, showing a few dummy events from a Squid log.

Scope of this Post

Since virtually every data source can be used to generate events, it is natural that the platform operator/analyst wants to add data from new sources over time. I use this post as a small check list, to document considerations for the “onboarding” process of new data sources. You might want to automate this process in a way that works for you. In future posts I will cover the steps in detail.

Onboard a New Data Source

I need to ingest data to Kafka

  • It’s very handy to use Apache NiFi for the ingest part. Just create a data flow consisting of two processors: a simple tcp listener to receive data and a Kafka producer to push the event further into Kafka.
  • I can also push data directly into Kafka if the architecture,  firewall and the source system allow it.
  • If there are no active components on the source system pushing data, I might want to install an instance of MiNiFi on my source system.
Screen Shot 2018-07-19 at 10.32.29
Simple example of a data ingest into Kafka via NiFi

Before I can ingest data into Kafka, I need a new Kafka topic

  • While the Kafka topics “enrichments” and “indexing” Kafka topics will be used by all data sources, the parser topics are specific to a data source.
  • I create a topic named “squid” with a number of partitions that corresponds to the amounts of data I receive.

To make the events searchable, i.e., to store the events into Apache Solr, I need to create a new Solr collection (or Elastic Search template)

  • For each parser Storm topology and parser Kafka topic, there is a parser Solr collection.
  • I add a few specific fields common to all Metron Solr collections and optionally define data source specific fields in the schema.xml.
  • I create a new collection named “squid” with a number of shards that corresponds to the amount of data I receive.

I define my parser in the Metron Management UI

  • I click the “+” button in the right bottom corner of the Metron Management UI.
  • I configure my parser by choosing a Java class and/or define a Grok pattern, insert a sample and check if the parsed output is what I expect.
  • I configure the parser: Kafka topic name, Solr collection name, parser config, enrichment defintions, threat intel logic, transformations, parallelism.
  • I save the parser configuration and press the “Play” button next to the new parser to start it.
Screen Shot 2018-07-18 at 08.37.04 1
Metron Management UI with my configured parsers. Currently only the Squid parser is running that produces the events in the first screenshot.

Outlook

I hope this post was helpful and informative. For questions I refer to the documentation, future posts, the Metron mailing list or post a question below.

How to Troubleshoot Apache Knox

Apache Knox is a gateway application and the door to access data in a data lake hidden behind a firewall. While the usage is fairly simple the setup, configuration and debugging process can be tedious due to many different components that Apache Knox ties together. I published this article also on Hortonworks Community Connection.

15403-17-05-08-security-concepts-knox
Common Security Architecture Using Apache Knox for Data Access

Start Small

  • First try to access the service directly before you go over Knox. In many cases, there’s nothing wrong with your Knox setup, but with either the way you setup and configured the service behind Knox or the way you try to access that service.
  • When you are familiar on how to access your service directly and when you have verified that it works as intended, try to do the same call on Knox.

Example:

  • You want to check if webhdfs is reachable so you first verify directly at the service and try to get the home directory of the service.
curl --negotiate -u : http://webhdfs-host.field.hortonworks.com:50070/webhdfs/v1/?op=GETHOMEDIRECTORY
  • If above request gives a valid 200 response and a meaningful answer you can safely check your Knox setup.
curl -k -u myUsername:myPassword https://knox-host.field.hortonworks.com:8443/gateway/default/webhdfs/v1/?op=GETHOMEDIRECTORY
  • Note: Direct access of WebHDFS and access of WebHDFS over Knox use two different authentication mechanisms: The first one uses SPNEGO which requires a valid Kerberos TGT in a secure cluster, if you don’t want to receive a “401 – Unauthorized” response. The latter one uses HTTP basic authentication against an LDAP, which is why you need to provide username and password on the command line.
  • Note 2: For the sake of completeness, I mention that here: Obviously, you direct the first request directly to the service host and port, while you direct your second request to the Knox host and port and specify which service.

The next section answers the question, what to do if the second command fails? (If the first command fails, go setup your service correctly and return later).

Security Related Issues

So what do the HTTP response codes mean for a Knox application? Where to start?

Authentication Issues

  • Very common are “401 – Unauthorized”. This can be misleading, since 401 is always tied to authentication – not authorization. That means you need to probably check one of the following items. Which of these items causes the error can be found in the knox log (per default /var/log/knox/gateway.log)
  • Is your username password combination correct (LDAP)?
  • Is your username password combination in the LDAP you used?
  • Is your LDAP server running?
  • Is your LDAP configuration in the Knox topology correct (hostname, port, binduser, binduser password,…)?
  • Is your LDAP controller accessible through the firewall (ports 389 or 636 open from the Knox host)?
  • Note: Currently (in HDP 2.6), you can specify an alias for the binduser password. Make sure, that this alias is all lowercase. Otherwise you will get a 401 response as well.

Authorization Issues

  • If you got past the 401s, a popular response code is “403 – Unauthorized”. Now this has actually really something to do with authorization. Depending on if you use ACL authorization or Ranger Authorization (which is recommended) you go ahead differently. If you use ACLs, make sure that the user/group is authorized in your topology definition. If you use Ranger, check the Ranger audit log dashboard and you will immediately notice two possible error sources:
    Your user/group is not allowed to use Knox.
    Your user/group is not allowed to use the service that you want to access behind Knox.
    Well, we came a long way and with respect to security we are almost done. One possible problem you could become is with impersonation. You need knox to be allowed to impersonate any user who access a service with knox. This is a configuration in core-site.xml: hadoop.proxyuser.knox.groups and hadoop.proxyuser.knox.hosts. Enter a comma separated list of groups and hosts that should be able to access a service over knox or set a wildcard *.
    This is what you get in the Knox log, when your Ranger Admin server is not running and policies cannot be refreshed.
2017-07-05 21:11:53,700 ERROR util.PolicyRefresher (PolicyRefresher.java:loadPolicyfromPolicyAdmin(288)) - PolicyRefresher(serviceName=condlahdp_knox): failed to refresh policies. Will continue to use last known version of policies (3) javax.ws.rs.ProcessingException: java.net.ConnectException: Connection refused (Connection refused)

This is also a nice example of Ranger’s design to not interfere with services if it’s down: policies will not be refreshed, but are still able operate as intended with the set of policies before Ranger crashed.

Application Specific Issues

Once you are past the authentication and authorization issues, there might be issues with how Knox interacts with its applications. This section might grow with time. If you have more examples of application specific issues, leave a comment or send me an email.

Hive

  • To enable Hive working with Knox, you need to change the transport mode from binary to http. It might be necessary in rare cases to not only restart Hiveserver2 after this configuration change, but also the Knox gateway.
  • This is what you get when you don’t switch the transport mode from “binary” to “http”. Binary runs on port 10000, http runs on port 10001. When binary transport mode is still active Knox will try to connect to port 10001 which is not available and thus fails with “Connection refused”.
2017-07-05 08:24:31,508 WARN hadoop.gateway (DefaultDispatch.java:executeOutboundRequest(146)) - Connection exception dispatching request: http://condla0.field.hortonworks.com:10001/cliservice?doAs=user org.apache.http.conn.HttpHostConnectException: Connect to condla0.field.hortonworks.com:10001 [condla0.field.hortonworks.com/172.26.201.30] failed: Connection refused (Connection refused) org.apache.http.conn.HttpHostConnectException: Connect to condla0.field.hortonworks.com:10001 [condla0.field.hortonworks.com/172.26.201.30] failed: Connection refused (Connection refused) at org.apache.http.impl.conn.DefaultHttpClientConnectionOperator.connect(DefaultHttpClientConnectionOperator.java:151) at org.apache.http.impl.conn.PoolingHttpClientConnectionManager.connect(PoolingHttpClientConnectionManager.java:353)
  • When you fixed all possible HTTP 401 errors for other services than Hive, but still get on in Hive, you might forget to pass username and password to beeline
beeline -u "<jdbc-connection-string>" -n "<username>" -p "<password>"
  • The correct jdbc-connection-string should have a format as in the example below:
jdbc:hive2://$KNOX_HOSTNAME:$KNOX_PORT/default;ssl=true;sslTrustStore=$TRUSTSTORE_PATH;trustStorePassword=$TRUSTSTORE_SECRET;transportMode=http;httpPath=gateway/default/hive
    • $TRUSTSTORE_PATH is the path to the truststore containing the knox server certificate, on the server with root access you could e.g. use /usr/hdp/current/knox-server/data/security/keystores/gateway.jks
    • $KNOX_HOSTNAME is the hostname where the Knox instance is running
    • $KNOX_PORT is the port exposed by Knox
    • $TRUSTSTORE_SECRET is the secret you are using for your truststore
  • Now, this is what you get, when you connect via beeline trying to talk to Knox from a different (e.g. internal) hostname than the one configured in the ssl certificate of the server. Just change the hostname and everything will work fine. While this error is not specifically Hive related, you will most of the time encounter it in combination with Hive, since most of the other services don’t require you to check your certificates. 
Connecting to jdbc:hive2://knoxserver-internal.field.hortonworks.com:8443/;ssl=true;sslTrustStore=truststore.jks;trustStorePassword=myPassword;transportMode=http;httpPath=gateway/default/hive 17/07/06 12:13:37 [main]: ERROR jdbc.HiveConnection: Error opening session org.apache.thrift.transport.TTransportException: javax.net.ssl.SSLPeerUnverifiedException: Host name 'knoxserver-internal.field.hortonworks.com' does not match the certificate subject provided by the peer (CN=knoxserver.field.hortonworks.com, OU=Test, O=Hadoop, L=Test, ST=Test, C=US)

HBase

  • WEBHBASE is the service in a Knox topology to access HBase via the HBase REST server. Of course, a prerequisite is that the HBase REST server is up and running.
  • Even if it is up and running it can occur that you receive an Error with HTTP code 503. 503: Unavailable. This is not related to Knox. You can track down the issue to a HBase REST server related issue, in which the authenticated user does not have privileges to e.g. scan the data. Give the user the correct permissions to solve this error.