4 Essential Stellar Core Functions to Do Enrichments in Apache Metron

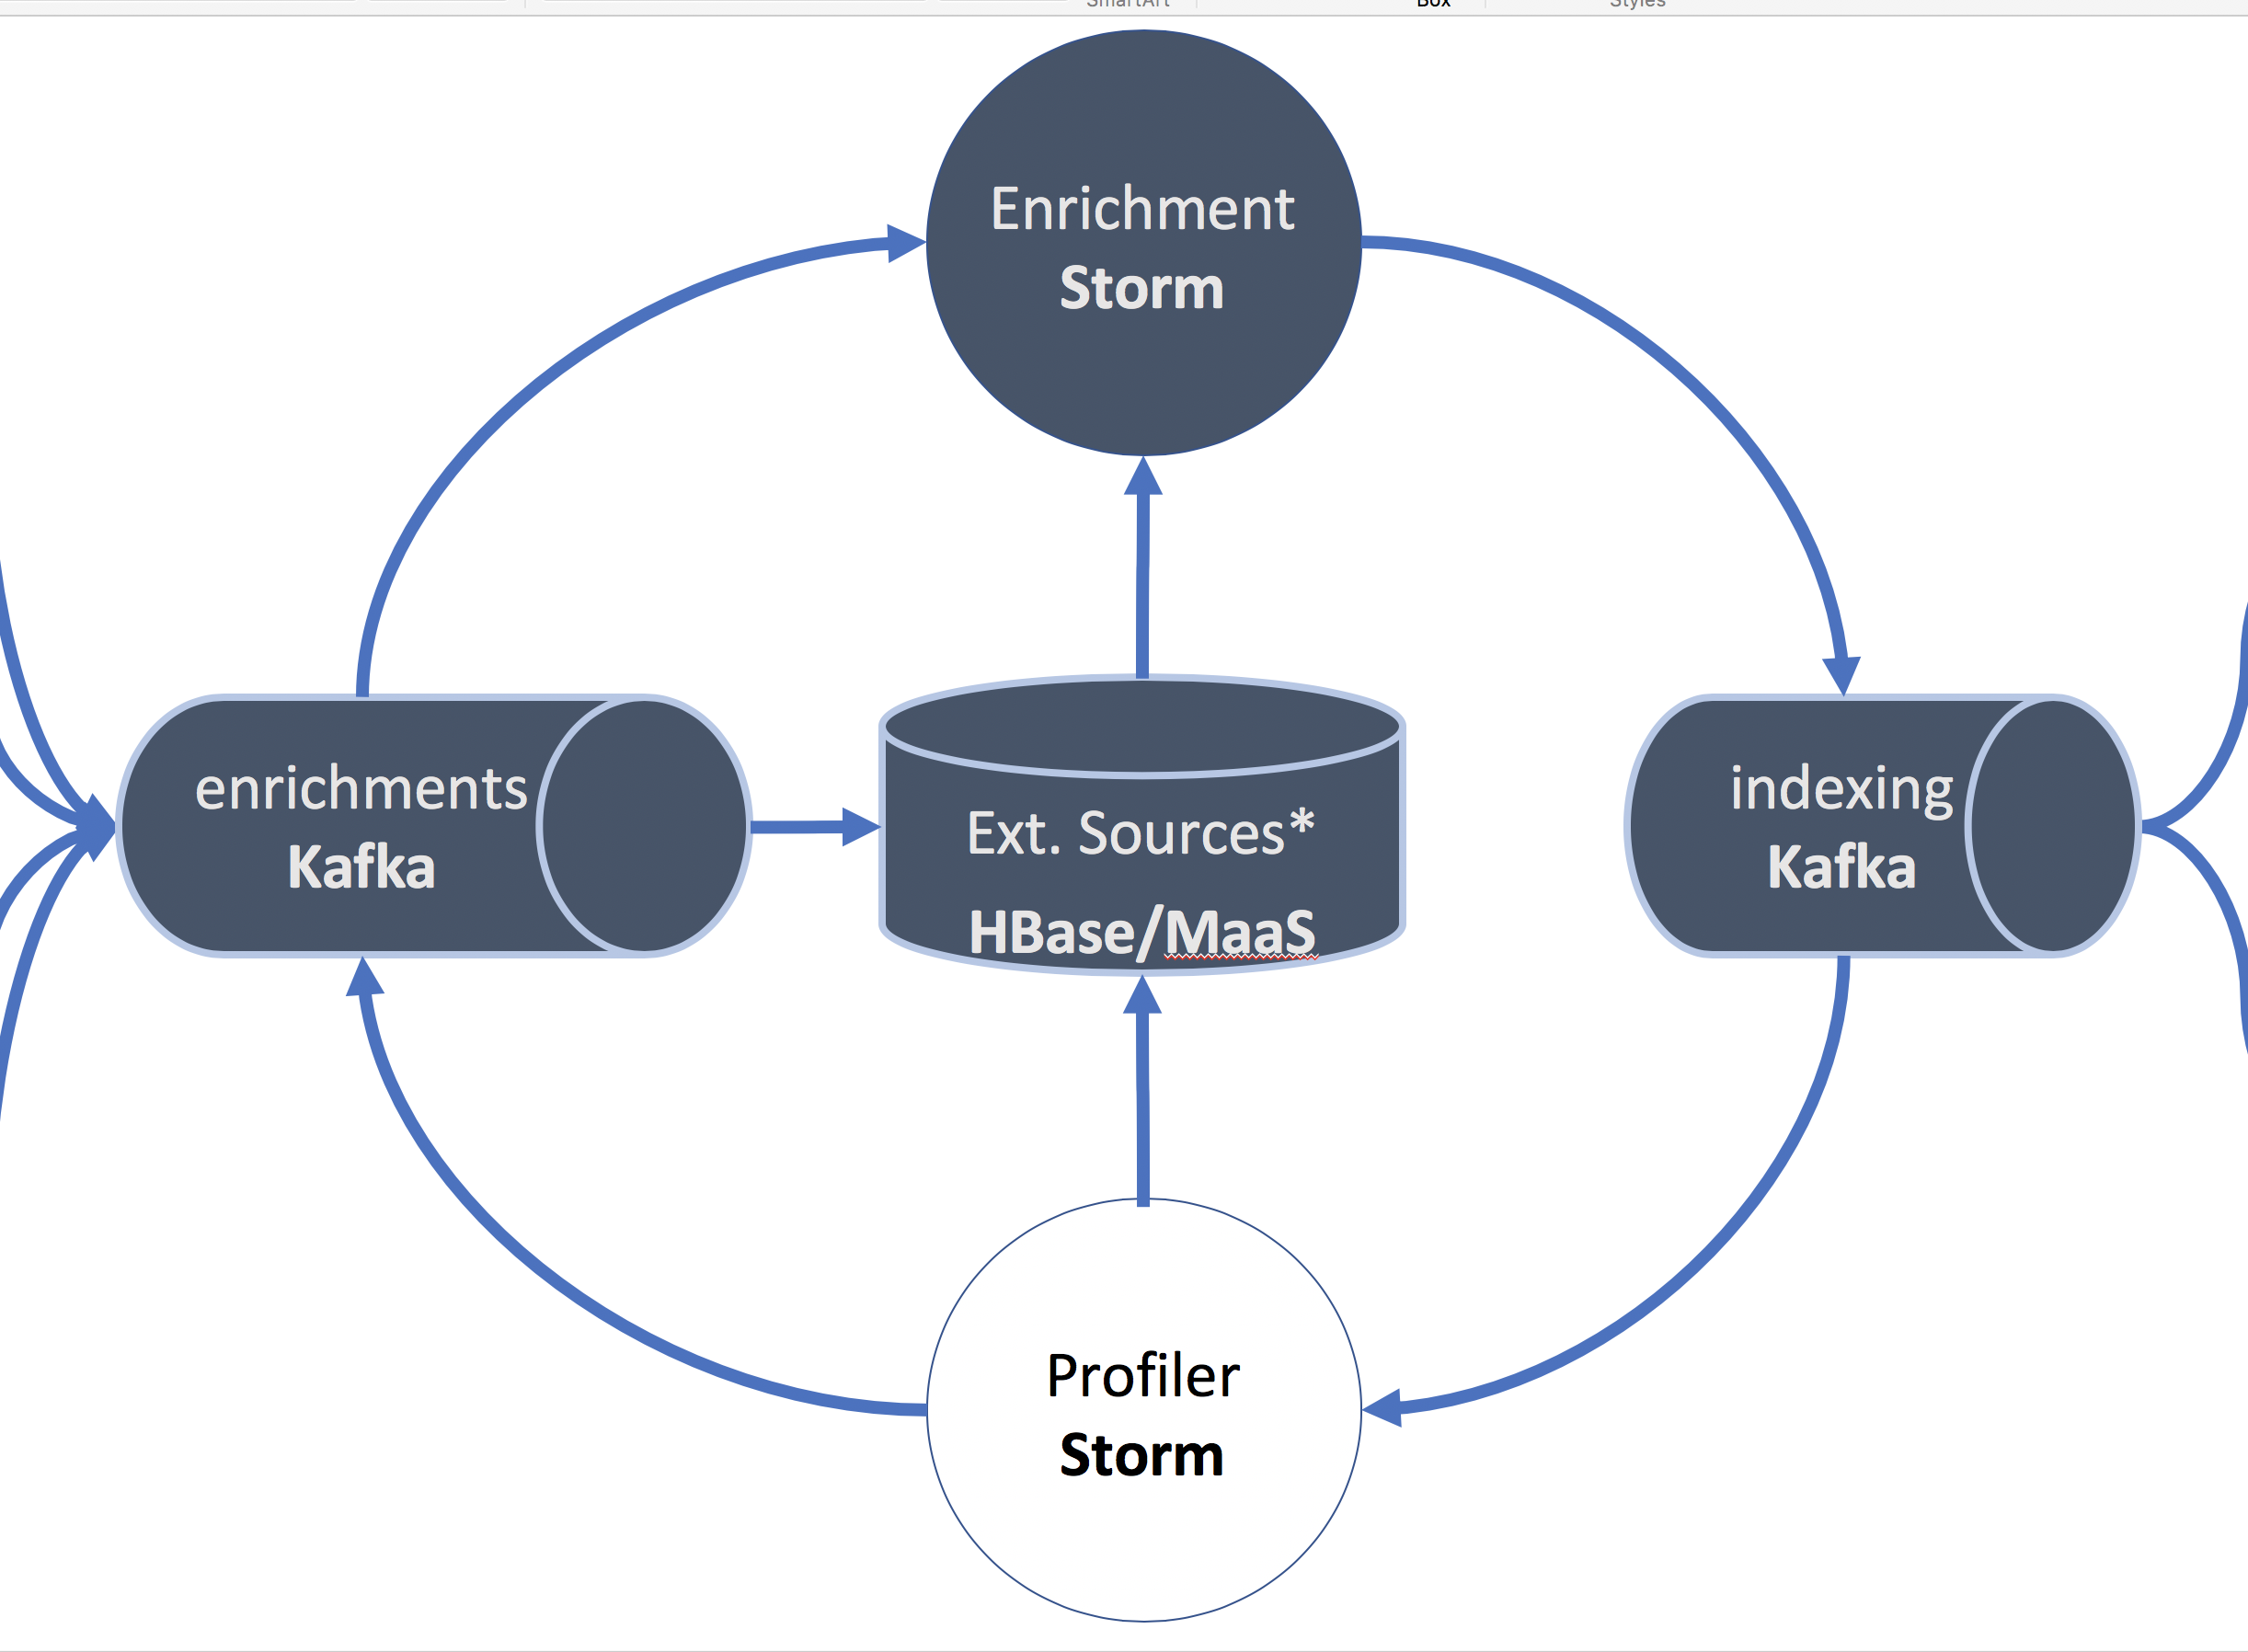
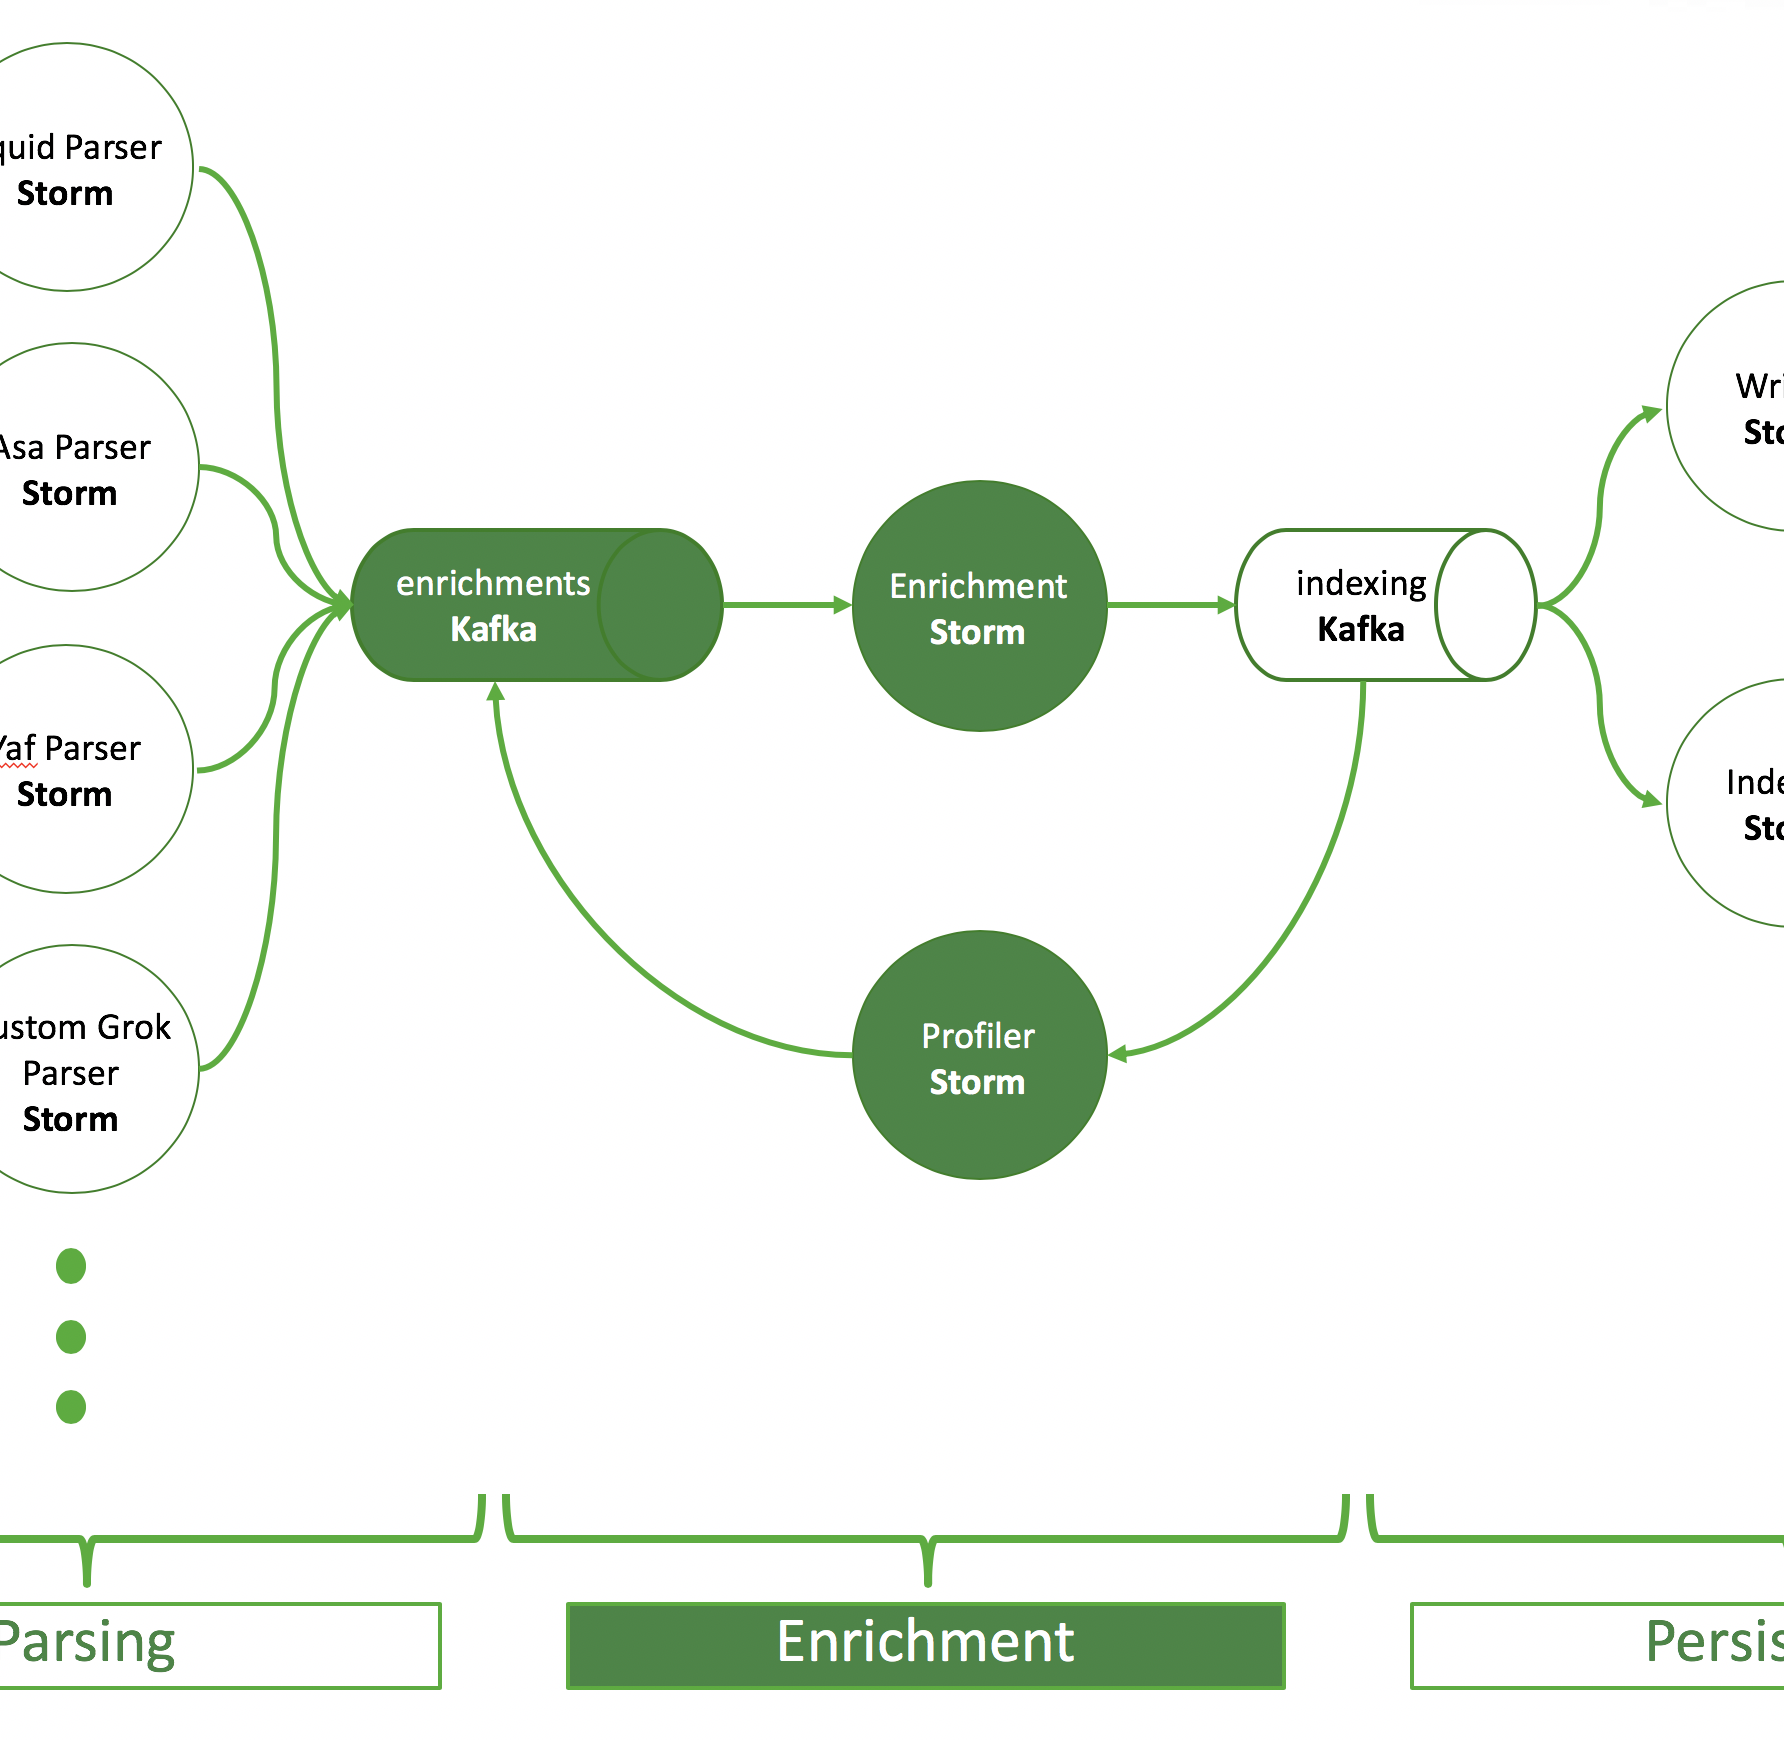
Apache Metron processes telemetry event by event in real time. Each type of event comes with its specific set of fields. E.g., a proxy log will always contain a source and a destination IP address. A log-on event will always contain a username of the person who wanted to log on. Adding fields to this set of fields in the processing pipeline from other data sources is called an enrichment. Metron offers multiple ways to enrich your telemetry.

This blog entry focusses on enrichments performed with Metron’s scripting language Stellar and shows the usage of 4 useful functions.

Types of Enrichments

First, let’s have a look at the Metron Enrichments documentation. You’ll find that there are multiple types of enrichments: geo, host, hbaseEnrichmentand stellar. As mentioned, we’ll discuss only stellar enrichments here, which is a powerful scripting language to get data from various sources and transform it to make it suitable for our use cases.

Before we start: as with every modern data app, always keep the use case in mind. Enrich and transform your data because it really makes your life easier and your job more fun (and provides some business value ;-)). If you do it because it’s just nice to have or just because it’s possible, you are wasting time to implement it, as well as computing power.

The Functions

ENRICHMENT_GET

ENRICHMENT_GET: Similarly to the hbaseEnrichment, which does a simple HBase look-up of the column family “t” on the “enrichments” table, you can do HBase look-ups. However, with ENRICHMENT_GET you can specify which table and column family to use for the lookup.

An ENRICHMENT_GET call made up of 4 string arguments looks like: ENRICHMENT_GET('userinfo', 'myuserid', 'mytable', 'mycf'). This performs a “get” query to the HBase table mytable using the composite key of userinfo and myuserid to retrieve all values stored in the columns of the column familiy mycf. All function arguments can be replaced by variables. This implies that you could use a different table, column family and key for each event even within a single data source based on derived values of each event. However, in reality, the most common (and maintainable and predictable) scenario is, to only use the second parameter as a variable and keep the other arguments constant for a certain parser and scenario.

Let’s have a look at a detailed example: Assume, we have onboarded a static enrichment source in HBase called userinfo using the HBase table static_enrichments and the column family s. For each user with a certain ID we have stored the following data:

row keystatic_enrichments:s
userinfo axc12345{"userid": "axc12345", "firstname": "Max", "lastname": "Power", "employee_status": "active"}
userinfo brt98764{"userid": "brt98764", "firstname": "Sara", "lastname": "Great", "employee_status": "retired"}

The Stellar expression below

userid := 'brt98764'
userinfo := ENRICHMENT_GET('userinfo', userid, 'static_enrichments', 's')

extracts a map with the following values

userinfo:

{
"firstname": "Sara"
"lastname": "Great"
"employee_status": "retired"
}

This map will be indexed to Elastic Search or Solr as

userinfo:firstname           --> Sara
userinfo:lastname --> Great
userinfo:employee_status --> retired

If you wanted to manipulate those values directly in a Metron workflow, e.g., to evaluate the employee status, you need to extract the value using the MAP_GET function.

MAP_GET

This function should be used to extract the value of a field from a map, e.g., from a map obtained from a HBase enrichment. In Stellar you could do

userinfo:employee_status := MAP_GET(userinfo, 'employee_status')

This assigns the value of the employee_status field of the userinfo map to the variable userinfo:employee_status. You can now use the employee status of the current user for further evaluations, e.g. to check if they are active.

is_active_user := userinfo:employee_status == 'active'

This will create a flag is_active_user as a new field that will be indexed. You can use this flag to define alerts and do scoring in Metron. In Elastic/Solr you can filter for active users using this boolean flag.

TO_LOWER/TO_UPPER

For comparisons TO_LOWER and TO_UPPER are essential. Before doing an enrichment converting one of our example usernames from AXC12345 to axc12345 will ensure that the lookup to HBase is successful

userid := TO_LOWER(userid)
userinfo := ENRICHMENT_GET('userinfo', userid, 'static_enrichments', 's')

There are many other useful string functions, to split, join or do other operations on strings. Go check them out.

ENRICHMENT_EXISTS

Sometimes you don’t want to add a ton of new fields to be indexed or you don’t even need all of the fields. You rather want to check if there *is* an enrichment at all. This can be used for blacklisting or whitelisting. Imagine you have an enrichment that looks somewhat like this, a HBase table whitelist, a column family b and an enrichment type domains.

keywhitelist:b
domains example.com{“domain”: “example.com”}
domains anotherexample.com{“domain”: “anotherexample.com”}

You see, that this table does not even contain useful additional information. You only want to check if a certain domain is blacklisted/whitelisted, like so:

mydomain := 'example.com'
is_blacklisted := ENRICHMENT_EXISTS('domains', mydomain, 'whitelist', 'b')

Above example will yield true for is_blacklisted an can later be used in threat intel logic and score assignment. It is also indexed to Solr/Elastic Search automatically.

Conclusion

Using Apache Metron, you can do powerful real-time enrichments for all kinds of use cases. Stellar is a powerful tool within Metron to help you do complex enrichments, manipulations and transformations in a simple way. There are many more functions. The four functions introduced in this blog entry are very commonly used when you do enrichments.

A Cookiecutter for Metron Sensors

What is “Cookiecutter”? Cookiecutter is a project that helps create boiler plate and project structures and is very famous and widely used in both the Python and data scientist communities. But you can use Cookiecutter for virtually anything, also for Apache Metron sensors.
Apache Metron is,…. well read some of the earlier blog posts, or the documentation. 🙂

What is the cookiecutter-metron-sensor Project?

The cookiecutter-metron-sensor project helps you to create sensor configuration files and it generates deployment instructions and a corresponding deployment script for the specific sensor. If you need all the details check out the README.md of the project on github:

https://github.com/Condla/cookiecutter-metron-sensor

Usage

To use the Metron sensor cookiecutter you only need one thing installed: cookiecutter:

pip install cookiecutter

Then you need to clone the project mentioned above and run the template. That’s it.

git clone https://github.com/Condla/cookiecutter-metron-sensor
cookiecutter cookiecutter-metron-sensor

Now simply fill in the prompts to configure the cookiecutter and the lion’s share of the work you need do to onboard a new data source is done. In the directory created you find a deployment script as well as another README.md file that you can use to document everything around your sensor as you go ahead and define your own transformations and enrichments. The README.md comes with the deployment instructions for its own specific parser.

Help to fill in the Cookiecutter prompts

While the cookiecutter-metron-sensor helps you to create and complete all of the Metron sensor configuration files, it does not do anything to explain what those prompts mean. You still need to read the documentation for this. However, to assist you in your efforts I’ll walk you through the configuration prompts and point you to the documentation, so you understand what and why you need to configure it.

  • sensor_name: This will be the name of the sensor in the Metron Management UI and determines the name of the parser Storm topology and the name of the Kafka consumer group.
  • index_name: The name Metron will use to store the result of the Metron processing pipeline in HDFS, Elastic Search or Apache Solr.
  • kafka_topic_name: This is the name of the Kafka topic the sensor parser will subscribe to.
  • kafka_number_partitions: The number of partitions of the Kafka topic above. It also determines the number of “ackers” and Storm “spouts” of the sensor parser topology. If you’re not sure it’s good to start with 2 and increase this number later on, if you see that the parser topology builds up lag. Check the Metron performance tuning guide for more information.
  • kafka_number_replicas: The number of replicas of the above Kafka topic. For data security and service availability reasons this should be 2 or 3.
  • storm_number_of_workers: The number of Storm workers you want to launch for the sensor parser topology. Each worker is it’s own JVM Linux process with memory assigned to it. All Storm processing units will be distributed over these workers. For availability reasons use 2 or more workers.
  • storm_parser_parallelism: This will affect how fast the sensor parser will be processing the incoming data stream. Per default cookiecutter sets it to your choice of kafka_number_partitions which as mentioned above affect the number of processing units reading the stream from Apache Kafka.
  • batch_indexing_size: This is the batch size written to HDFS per writer and should be determined based on the parallelism and the number of events per second your are dealing with. Again, refer to the performance tuning guide.
  • ra_indexing_size: Similar to batch_indexing_size, but for indexing to Elastic Search or Solr.
  • write_to_hdfs: Select true if you want to use the batch indexing capabilities to HDFS.
  • write_to_elastic_search: Select true if you want to use the random access indexing capabilities to Elastic Search.
  • write_to_solr: Select true if you want to use the random access indexing capabilities to Apache Solr.
  • write_to_hbase: Choose false if you want a “common” Metron pipeline [Parsing/Transforming] –> [Enrichment] –> [Indexing] –> [HDFS/Elastic/Solr]. Choose true if you want to onboard a stream ingest enrichment source [Parsing/Transforming] –> [HBase].
    shew_table: The HBase table name you want to write to in case you use write_to_hbase. You can ignore this and use the defaults in case you don’t.
    shew_cf: The HBase column family name you want to write to in case you write_to_hbase. You can ignore this and use the defaults in case you don’t.
    shew_key_columns: The name of the field you want to act as the lookup-key for you enrichment source in case you write_to_hbase. You can ignore this and use the defaults in case you don’t.
    shew_enrichment_type: The name of the enrichment to uniquely identify this, when you want to use this enrichment. It will be part of the lookup-key. Only important in case you write_to_hbase. You can ignore this and use the defaults in case you don’t.
  • parser_class_name: Select one of the possible parsers. Note: As all of these values, you can change that later in the Metron Management UI if you are using a custom parser or can’t find you parser in this list.
  • grok_pattern_label: Per default this is the sensor_name in upper case letters, but you might want to change this.
  • zookeeper_quorum: This is important for the deployment script so you can create a Kafka topic. If you deployed Metron using Ambari you’ll find this information in the Ambari UI.
  • elastic_user: Important for the deployment. If your Elastic Server does not use the X-Pack for security you can leave this field empty.
  • elastic_master: The URL to the Elastic Search Master server
  • metron_user: An admin user that has access to the Metron REST server
  • metron_rest: The URL to the Metron REST server.

Note: This cookiecutter-metron-sensor project is very young and work in progress to continuously add new features with time with the aim to make it even easier for a cyber security operator to master threat intelligence data flows.

Apache Metron Architecture

In one of my previous articles I wrote about Apache Metron as an Example for a Real-Time Streaming Pipeline. Since then, I’ve refined the figure I’ve used to explain the architecture. In this article, I just briefly explain the updated part of the figure and add a video of myself talking about Apache Metron at the Openslava conference in Bratislava using those updated figures in my slides.

Enrichment


I added a few more details into the figure on the enrichment part:

  • The enrichment Storm topology is capable of using external database sources on-boarded into HBase or from the Model as a Service (MaaS) capability.
  • The arrow from the enrichments Kafka topic is not entirely correct, but should depict that data sources coming in in real-time can be stored in HBase as an enrichment source. Correct would be to draw the arrow to HBase directly from the parser topology.
  • Huge data sets can be fairly easily batch loaded into HBase as an enrichment source.
  • The profiler is a Storm topology that saves data of certain (user-defined) entities in a time series to HBase. From there it can be used as an enrichment for any future events as aggregates over time.

Open Source Cyber Security with Apache Metron @ Openslava2018

How to Define Elastic Search Templates for Apache Metron

When you onboard a new data source on Apache Metron and you use Elastic Search (ES) as your indexing + search engine you need to specify and submit an ES template before the indexing topology attempts the first write to the ES cluster.

The template should contain the following items:

  • Dynamic fields for possible geo enrichments of any ip address field,
  • dynamic fields for other kinds of enrichments
  • well defined static fields (“properties”) based on the fields that are unique to this parser.
  • As found in the official Metron docs: The metron_alert field type needs to be nested. As per the documentation, if you forget to do this, you’ll run into this Exception:
QueryParsingException[[nested] failed to find nested object under path [metron_alert]];

Use the Elastic Search Reference Manual to get familiar which data types Elastic Search offers and how to use them!

How to Create an Elastic Search Template for an Apache Metron Parser

An efficient way to create your own template is to get an existing one that comes with Apache Metron, adapt it and use it to create your own.

  • Step 1: Obtain an existing template, e.g., the yaf_index:
export ELASTICSEARCH_MASTER=condla0.field.hortonworks.com:9200
curl -X GET $ELASTICSEARCH_MASTER/_template/
curl -X GET $ELASTICSEARCH_MASTER/_template/yaf_index | python -m json.tool > template.json
  • Step 2: Modify it to your needs. Assume we are creating a squid template
    • Remove the outer most json layer. The "template" key must be on the top level.
    • Rename any “yaf” fields to “squid” fields.
    • Refer to the list in the beginning of this blog entry to get an idea what else you need to modify.
    • A working squid template can be found here.
    • Note that you can find a set of fields that all data sources should have in common:
      • timestamp
      • guid
      • source:type
      • ip_dst_addr
      • ip_src_addr
      • ip_dst_port
      • ip_src_port
    • as well as a set of fields unique to squid:
      • action
      • bytes
      • code
      • elapsed
      • method
      • url
vi template.json
{
  "template": "squid_index",
  "mappings": {
    "squid_doc": {
       "dynamic_templates": [
       ...
       ]
       "properties": {
       ...
       }
    }
  }
}
  • Step 3: Submit the new template:
curl -X POST $ELASTICSEARCH_MASTER/_template/squid_index -d @template.json
  • Step 4: Check if template was created correctly
curl -X GET $ELASTICSEARCH_MASTER/_template | python -m json.tool

You can find a basic, fully working squid template here.

Troubleshooting

If you query a collection via the Kibana Metron UI and see an error similar to the following exception in the Elastic Search Master log, your template is either not valid or the index is not using it.

Caused by: java.lang.IllegalArgumentException: Fielddata is disabled on text fields by default. Set fielddata=true on [source:type] in order to load fielddata in memory by uninverting the inverted index. Note that this can however use significant memory. Alternatively use a keyword field instead.

 Thus, after you created the template and after you ingested your first events via the random access indexing topology, you want to check if your (rollover) index was created with the correct template:

# check if our squid index is there:
curl -X GET $ELASTICSEARCH_MASTER/_cat/indices
## example output:
## yellow open squid_index_2018.11.26.23 l7BO0FflRg6H0op3fM5wkw 5 1  5  0  48.3kb  48.3kb
## yellow open .kibana                   sEGp3YyZSXu40A1nRv1umQ 1 1 46 41 207.4kb 207.4kb

# check in the logs if there is a line that specifies which template was used when the index was created:
tail -f /var/log/elasticsearch/metron.log
## example output:
## ...
## [2018-11-26T23:13:58,395][INFO][o.e.c.m.MetaDataCreateIndexService][condla0.field.hortonworks.com] [squid_index_2018.11.26.23] creating index, cause [auto(bulk api)], templates [squid_index], shards [5]/[1], mappings [squid_doc]
## ...

Important Things to Note

  • /var/log/elasticsearch/metron.log is the most important log file for debugging ES template related actions
  • If you want to make your new data source available in Kibana, don’t forget to add the index pattern – in our case "squid_index_*":
    • Kibana: Management –> Create Index Pattern

How to Create a New Parser for Apache Metron

This blog entry goes through the process of a Cyber Platform Operator creating a new parser for Apache Metron and everything you need to consider to make this process as smooth as possible. This can also be seen as a checklist or to-do list when you are creating a new parser.

Assumption: You know what Metron is, the data source is fully onboarded on your platform and the parser config is the only thing that’s missing. Here are the things you need to consider to onboard a new source.

In general, this article walks you through 3 phases:

  • Check if you can re-use an existing parser. If so, you’re done, the testing part of phase 2 still applies, though.
  • Build and test a protoype. Grok is your friend.
  • Write your parser in Java.

Phase 1: Check if you can use an existing parser

  • Get a sample set of your source to test with. The more diverse you expect the formats of the same source to be, the bigger your sample size should be. 20 should be ok to start with.
  • Check the format of the string.
    • If it is in JSON format, use the JSON parser!
    • If it’s a comma separated line, use the CSV parser!
    • Or generally: If it’s in a format of any of the included Metron parsers, use this parser: CEF, Lancope, PaloAltoFirewall, Sourcefire, Logstash, FireEye, Asa, Snort, JSONMap, Ise, GrokWebSphere, Bro,….
    • If it’s something else use the Grok parser!

Phase 2: Build and test a (Grok) prototype

In the rest of the article I assume that you don’t re-use one of the included parsers, which is why you want to create your own custom one. Thus, you leverage the Grok parser. However, the test setup described below and can be used for any kind of parser.

  • Use http://grokdebug.herokuapp.com/ to test one of your samples and start with adding  %{GREEDYDATA:message} and continuously add more precise parsing statements and check if it compiles. If you’re new to Grok start here: https://logz.io/blog/logstash-grok/.
  • Test all of your samples in the app to check if your Grok statement is general enough.
  • You also might want to append %{GREEDYDATA:suffix}(\n|\r|\r\n)?+ to catch any kind of additional data, as well as filter newline and optional carriage-return fields at the end of a line. That depends on how diverse or clean your data source is.
  • Configure and validate the parser in Metron Management UI using “Grok” as parser type and paste the grok statement in the field “Grok Statement”.
    • Attention: don’t forget to define the timestampField, the timeFields and the dateFormat. If you don’t specify those values, the parser validation will fail with an “error_type”: “parser_invalid”. The field configured as the timestampField will be converted into a timestamp parsed based on the inputs from the dateFormat field. Use the Joda time date format documented here.
    • When the datetime is correctly parsed, double-check if the calculated timestamp matches the input time. This online epochconverter comes handy.
    • Note: to consolidate your view of the data across many sources, make sure you name the source ip address “ip_src_addr”, your destination ip address “ip_dst_addr”, your source port “ip_src_port” and your destination port “ip_dst_port”.
    • Note: In general, every parser – not only the Grok parser – has their specific required/default parameters to be set. Read the parser docs to be sure to configure the parsers correctly. Below is an example of how the parserConfig part of your parser configuration file should look like. You configure this part in the Metron Management UI:
metron_managementui_parser.png
  • Double check:
    • If Grok statements are stored in the configured HDFS path: /apps/metron/patterns/mycustomparser
    • If the Zookeeper configuration is up to date: bin/zkCli.sh -server <zookeeper-quorum> get /metron/topology/parsers/mycustomparser.  Specifically look for the parserConfig part shown below.
{
  ...
  "parserClassName": "org.apache.metron.parsers.GrokParser",
  "parserConfig": {
    "grokPath": "/apps/metron/patterns/mycustomparser",
    "patternLabel": "MYCUSTOMPARSER",
    "timestampField": "datetime",
    "timeFields": ["datetime"],
    "dateFormat": "yyyy-MM-dd HH-mm-ss",
    "timezone": "UTC"
  },
  ...
}
metron_parser_test_setup.png
Metron parser test setup: 1. Consume from the parser topic (assuming you initially ingested your sample already) 2. Control your flow rate to release only 1 event per 5 seconds (or which ever speed you like) 3. Write back into the parser topic and check if the event is being processed correctly.
  • Ingest the messages into the Kafka topic using your NiFi test setup and check if they are successfully persisted in your desired collection.

Phase 3: Make your Metron parser production ready

Once you have your custom parser up and running and improved it continuously you want to create something more stable with higher performance than Grok statements. However, nothing is for free. You need to get your hands dirty in Java. Fortunately, it’s not a lot of dirt and it’s quite easy to write your own parser by extending the BasicParser class.

  • Check out this part of the documentation to get a walkthrough: 3rd party parsers
  • In this part of the documentation you’ll learn to:
    • Get to know which dependencies you need.
    • Implement a parser method of your custom parser class extending the BasicParser class.
    • Build the jar and deploy it in the extra-parser directory.
    • Restart Metron Rest service to pick up the new parser from your jar file.
    • Add your parser in the Metron Management UI by choosing your parser type.
    • Configure and start your parser.
  • Stop your interim Grok parser and start your custom Java parser.

Apache Metron as an Example for a Real Time Data Processing Pipeline

In my previous blog post I was writing a little bit about what Apache Metron is and How to Onboard a New Data Source in Apache Metron.

Now I want to shine some light on how the ingestion pipeline architecture looks like. Since I just got started with Apache Metron myself, I hope this helps to kickstart your cyber security efforts. Rather than going too much into the details of what the components do, I’d like to provide a basic overview about which components there are.

This architecture can be generalized for all kinds of streaming use cases. The pipeline uses Apache NiFi for ingest, Apache Kafka as an event buffer, Apache Storm for stream processing, Apache Hadoop for long term storage and Apache Solr for short term random access storage. If you design your own pipeline for a different use case, you can, e.g., swap Apache Storm with frameworks such as Apache Flink or Spark Streaming (or any other frameworks out in the wild with their pros and cons). Choosing the right piece of technology strongly depends on numerous factors, I’m not going into in this article.

metron_pipeline
End to End Processing Pipeline for Apache Metron

Ingest

The most important part for Apache Metron is to get the telemetry data into an Apache Kafka topic. In the figure below you can see that there is a Kafka topic and a corresponding parser for each format. Usually, there is one Kafka topic per source type, because each source typically comes in its own special format, but it’s also possible that data of one source has multiple formats or multiple sources have the same format.

metron_pipeline_ingest_closeup.png
  • Apache NiFi is being used as the data integration tool.
  • In the figure, I added an example of a MiNiFi instance to the Squid Access Log source. In this case MiNiFi is installed on the Squid server node and acts as a log forwarder.
  • It’s also possible that sources write directly into Kafka, if they support that. In some cases this might even be a requirement due to performance constraints.

Parsing

As described in the ingest part: there is a topic for each parser format and an Apache Storm topology reading from this Kafka topic and doing the parsing. A parsed event is then written into the so-called “enrichments” topic.

metron_pipeline_parsing_closeup
  • The parsing has two purposes:
    • it brings all ingest format into a JSON format.
    • it introduces a common set of fields shared among all data sources, as well as unique fields that are special to each source.
  • Some parsers of common formats are included in the Metron project.
  • If there is no parser (that works) for your format, you can use Grok to quickly prototype and launch your parser before you write it in Java.
  • It is also possible to launch parser chains to extract information that is convoluted in different formats.
  • You can also decide to run only one topology handling multiple parsers in a so-called aggregated parser. This can be combined with parser chains.

Enrichment

The purpose of the enrichment Storm topology is to pick up events from the enrichments topic and add information from external sources. The enriched output is written to an indexing topic.

metron_pipeline_enrichment_closeup
  • A typical enrichment is a lookup in a database to convert an IP address into geo information
  • The profiler uses sliding windows to create aggregates/statistics in certain time windows, so-called profiles.
  • These profiles can be used to enrich data.
  • Metron helps you use any data in HBase to enrich your events.

Persisting

There are two Storm topologies to read from the indexing topic that persist events, the batch indexing topology and the random access indexing topology. The first utilizes an HDFSBolt to write data to HDFS. The latter one indexes data in Apache Solr.

metron_pipeline_persisting_closeup
  • There is one Solr collection per data format.
    • This way the parsed fields and definitions are kept clean and separated.
    • Also, you can authorize different users and groups to different data sources. This is even easier with the Solr Plugin for Apache Ranger.
  • HDFS is used as long term storage for analytical purposes and to use the data to create machine learning models.
  • Solr is being used for direct fast random access and search capabilities, e.g. by the Metron Alerts UI. It makes sense to store the data for only a limited amount of time for performance reasons.
  • It’s quite easy to create a new collection. I’ve described it on this github gist. I’ve added properties in the solrconfig.xml to define a “time to live” for an event in Solr, after which the event will be deleted from the collection.
  • Instead of Solr, you can use Elastic Search.

Conclusion

I hope this can be useful for somebody, either trying to implement Metron or somebody interested in how modern streaming pipelines look like in general. If you have questions, don’t hesitate to ask the experts in the Metron mailing list (user@metron.apache.org) or get support from the Hortonworks Community.

How to Onboard a New Data Source in Apache Metron

Introduction

Apache Metron aims to be a tool for analysts in a cyber security team to help them defining intelligent alerts, detecting threats and work on them in real-time. This is the first blog post in a row to ease operations and share my experiences with Apache Metron. Thus, it serves as an introduction to Metron.

Technical Introduction

Apache Metron is a cyber security platform making heavy use of the Hadoop Ecosystem to create a scalable and available solution. It utilizes Apache Storm and Apache Kafka to parse, enrich, profile, and eventually index data from telemetry sources, such as network traffic, firewall logs, or application logs in real-time. Apache Solr or Elastic Search are used for random access searches, while Apache Hadoop HDFS is used for long term and analytical storage. It comes with its own scripting language “Stellar” to query, transform and enrich data. A security operator/analyst uses the Metron Management UI to configure and manage input sources as well the Metron Alerts UI to search, filter and group events.

Screen Shot 2018-07-18 at 08.07.45
Metron Alerts UI, showing a few dummy events from a Squid log.

Scope of this Post

Since virtually every data source can be used to generate events, it is natural that the platform operator/analyst wants to add data from new sources over time. I use this post as a small check list, to document considerations for the “onboarding” process of new data sources. You might want to automate this process in a way that works for you. In future posts I will cover the steps in detail.

Onboard a New Data Source

I need to ingest data to Kafka

  • It’s very handy to use Apache NiFi for the ingest part. Just create a data flow consisting of two processors: a simple tcp listener to receive data and a Kafka producer to push the event further into Kafka.
  • I can also push data directly into Kafka if the architecture,  firewall and the source system allow it.
  • If there are no active components on the source system pushing data, I might want to install an instance of MiNiFi on my source system.
Screen Shot 2018-07-19 at 10.32.29
Simple example of a data ingest into Kafka via NiFi

Before I can ingest data into Kafka, I need a new Kafka topic

  • While the Kafka topics “enrichments” and “indexing” Kafka topics will be used by all data sources, the parser topics are specific to a data source.
  • I create a topic named “squid” with a number of partitions that corresponds to the amounts of data I receive.

To make the events searchable, i.e., to store the events into Apache Solr, I need to create a new Solr collection (or Elastic Search template)

  • For each parser Storm topology and parser Kafka topic, there is a parser Solr collection.
  • I add a few specific fields common to all Metron Solr collections and optionally define data source specific fields in the schema.xml.
  • I create a new collection named “squid” with a number of shards that corresponds to the amount of data I receive.

I define my parser in the Metron Management UI

  • I click the “+” button in the right bottom corner of the Metron Management UI.
  • I configure my parser by choosing a Java class and/or define a Grok pattern, insert a sample and check if the parsed output is what I expect.
  • I configure the parser: Kafka topic name, Solr collection name, parser config, enrichment defintions, threat intel logic, transformations, parallelism.
  • I save the parser configuration and press the “Play” button next to the new parser to start it.
Screen Shot 2018-07-18 at 08.37.04 1
Metron Management UI with my configured parsers. Currently only the Squid parser is running that produces the events in the first screenshot.

Outlook

I hope this post was helpful and informative. For questions I refer to the documentation, future posts, the Metron mailing list or post a question below.