While the number of tools in the Open Source Big Data and Streaming Ecosystem still grows, frameworks that are around for a long time become highly mature and feature rich, some may say “enterprise ready”. Thus, it’s not surprising to me to see a lot of my customers who are new to the whole ecosystem are struggling understanding the basics of each of these tools. The first question always is, “When do I use which tool?”, but this is often not enough without having seen a certain tool in action.
This and a tweet that I recently stumbled upon, were motivation enough for me to explain the most basic things you can do with these tools. Each future blog post will contain a description of the most basic operation of exactly one tool and a detailed explanation of this and only this basic operation and none of the advance features, that might confuse beginners.

In this first blog post of the series, I want to categorise the tools – as good as possible – and describe each of them with as few words as possible, ideally less than a full sentence. Then I’ll introduce each of these tools in arbitrary order in subsequent blog posts. This should help anybody get started and then attend trainings or do self study to get to know all the features that are supposed to make our lives easier processing and managing data, and lower the barrier to get started with each of these.
Disclaimer: this overview is highly opinionated, most probably biased by my own experience and definitely incomplete ( = not exhaustive). I’m definitely up for discussion and open for questions on why I put a certain tool into a certain category and why certain categories are named as they are. So don’t hesitate to reach out to me 🙂
Tools and Frameworks
I’m re-using the slides that I recently created for a “lunch and learn” session. You’ll notice that a lot if not all of the tools appear in multiple categories.
( ) parentheses mean that I had some issues and spent some time considering if I really would put this tool in a certain category, because it strictly doesn’t fit. I probably put it there, because it *can* be used or it is often *used in combination* with tools in this category.
[ ] parentheses mean that the tool is not very popular anymore. It might still be supported, highly used and mature, but is just not popular anymore and likely to fade away and being replace by another tool.
All – Categorized by Function
“All” doesn’t mean every past and future existing tool in the ecosystem. All in this article means just all the tools that I consider and that are available in one of the distributions of HDP, CDH or the new Cloudera Data Platform (CDP)


Note: “Technical Frameworks” are not frameworks you’d work with on a daily base or at all. They’re just there and enable the rest of the cluster to work properly or enable certain features. All of the frameworks/tools/projects in this category are very different from each other.
Processing – Categorised by Speed of Data
Here “Data at Rest” means, that data could possibly be old, historic data, while “Streaming Data” considers event based/stream processing – processing of data while it’s on it’s why from creation at the source to the final destination. The final destination could be a “Data at Rest” persistence engine/database.

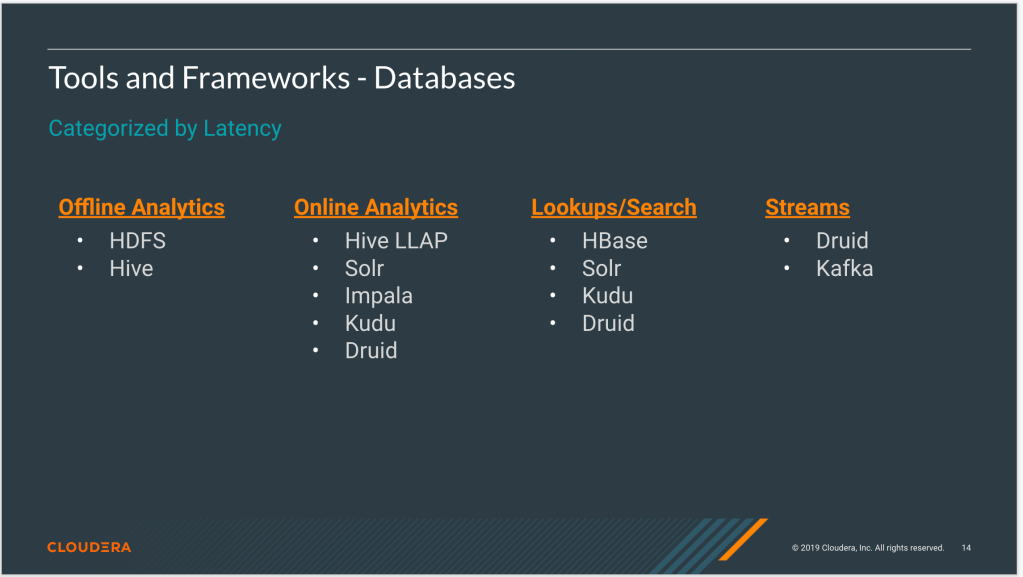
Databases – Categorised by Latency
Latency here could refer to two different things:
- How up-to-date the data in the database is
- How long a query to the database takes to respond with the results
I don’t distinguish those two in this categorisation, which would make this exercise a bit too detailed and tedious. Generally, it’s important to consider both to choose an adequate database for a certain use case.
All – Categorised by Use Case
I chose four typical use cases for this categorisation. A lot of other use cases can be realized

List of All Tools and Frameworks
Again, “All” doesn’t mean all tools currently available in the open source big data ecosystem. “All” means the bulletproof, tested, compatible set of components that easily cover the most common Big Data and Streaming use cases.
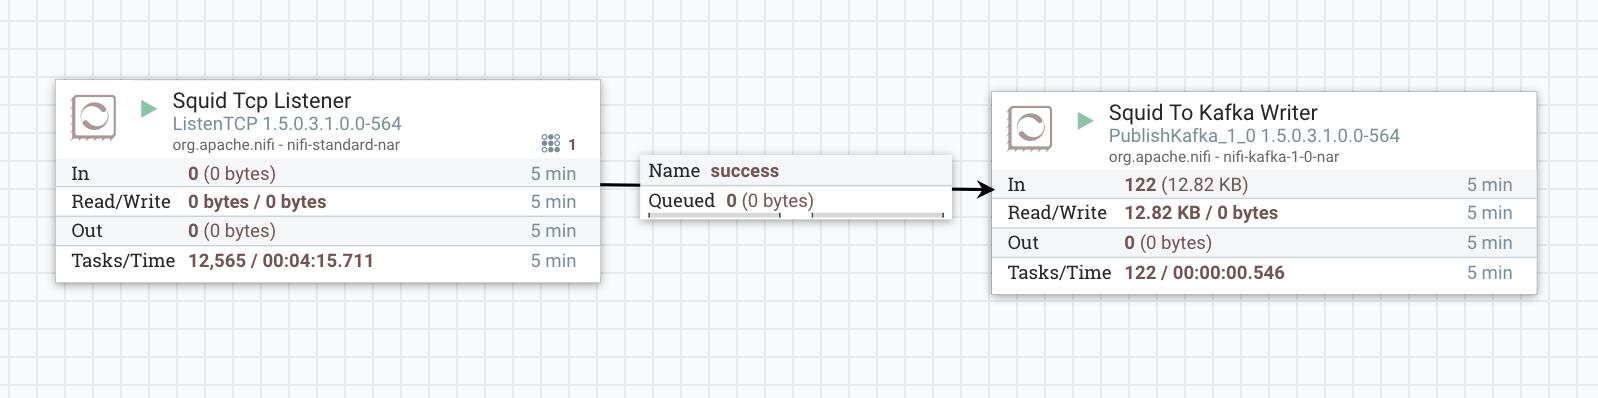
Apache NiFi: Manage data flows; get data from A to B and process it on the way with a UI
Apache Spark: Use dataframes to extract, transform and load data, train and evaluate ML models.
Apache Kafka: Publish, persist and subscribe to events
Cloudera Data Science Workbench: Explore data; use Python and Spark; deploy and manage ML models
Apache Hive: Data Warehousing engine; SQL on distributed/object storage
Apache Impala: Data Hub engine; SQL on distributed/object storage
Apache Kudu: Quickly analyse fast data
Apache Oozie: Schedule jobs
Apache Sqoop: Transfer data from and to relational databases
Apache Druid: Analyse realtime data with high performance
Apache Solr: Index and search text
Apache Flink: Process streams of data using a programming interface
Apache Storm: Process streams of data using a programming interface
Apache HBase: Consistent, scalable noSQL database; low latency look-ups; unstructured data
Apache Phoenix: Do SQL on top of HBase
Apache Zeppelin: Notebook application tightly integrated with Hive and Spark
Apache Ranger: Define policies to permit or restrict access to data
Apache Knox: Manage access to services
Apache Atlas: Manage meta data