In one of my previous articles I wrote about Apache Metron as an Example for a Real-Time Streaming Pipeline. Since then, I’ve refined the figure I’ve used to explain the architecture. In this article, I just briefly explain the updated part of the figure and add a video of myself talking about Apache Metron at the Openslava conference in Bratislava using those updated figures in my slides.
Enrichment
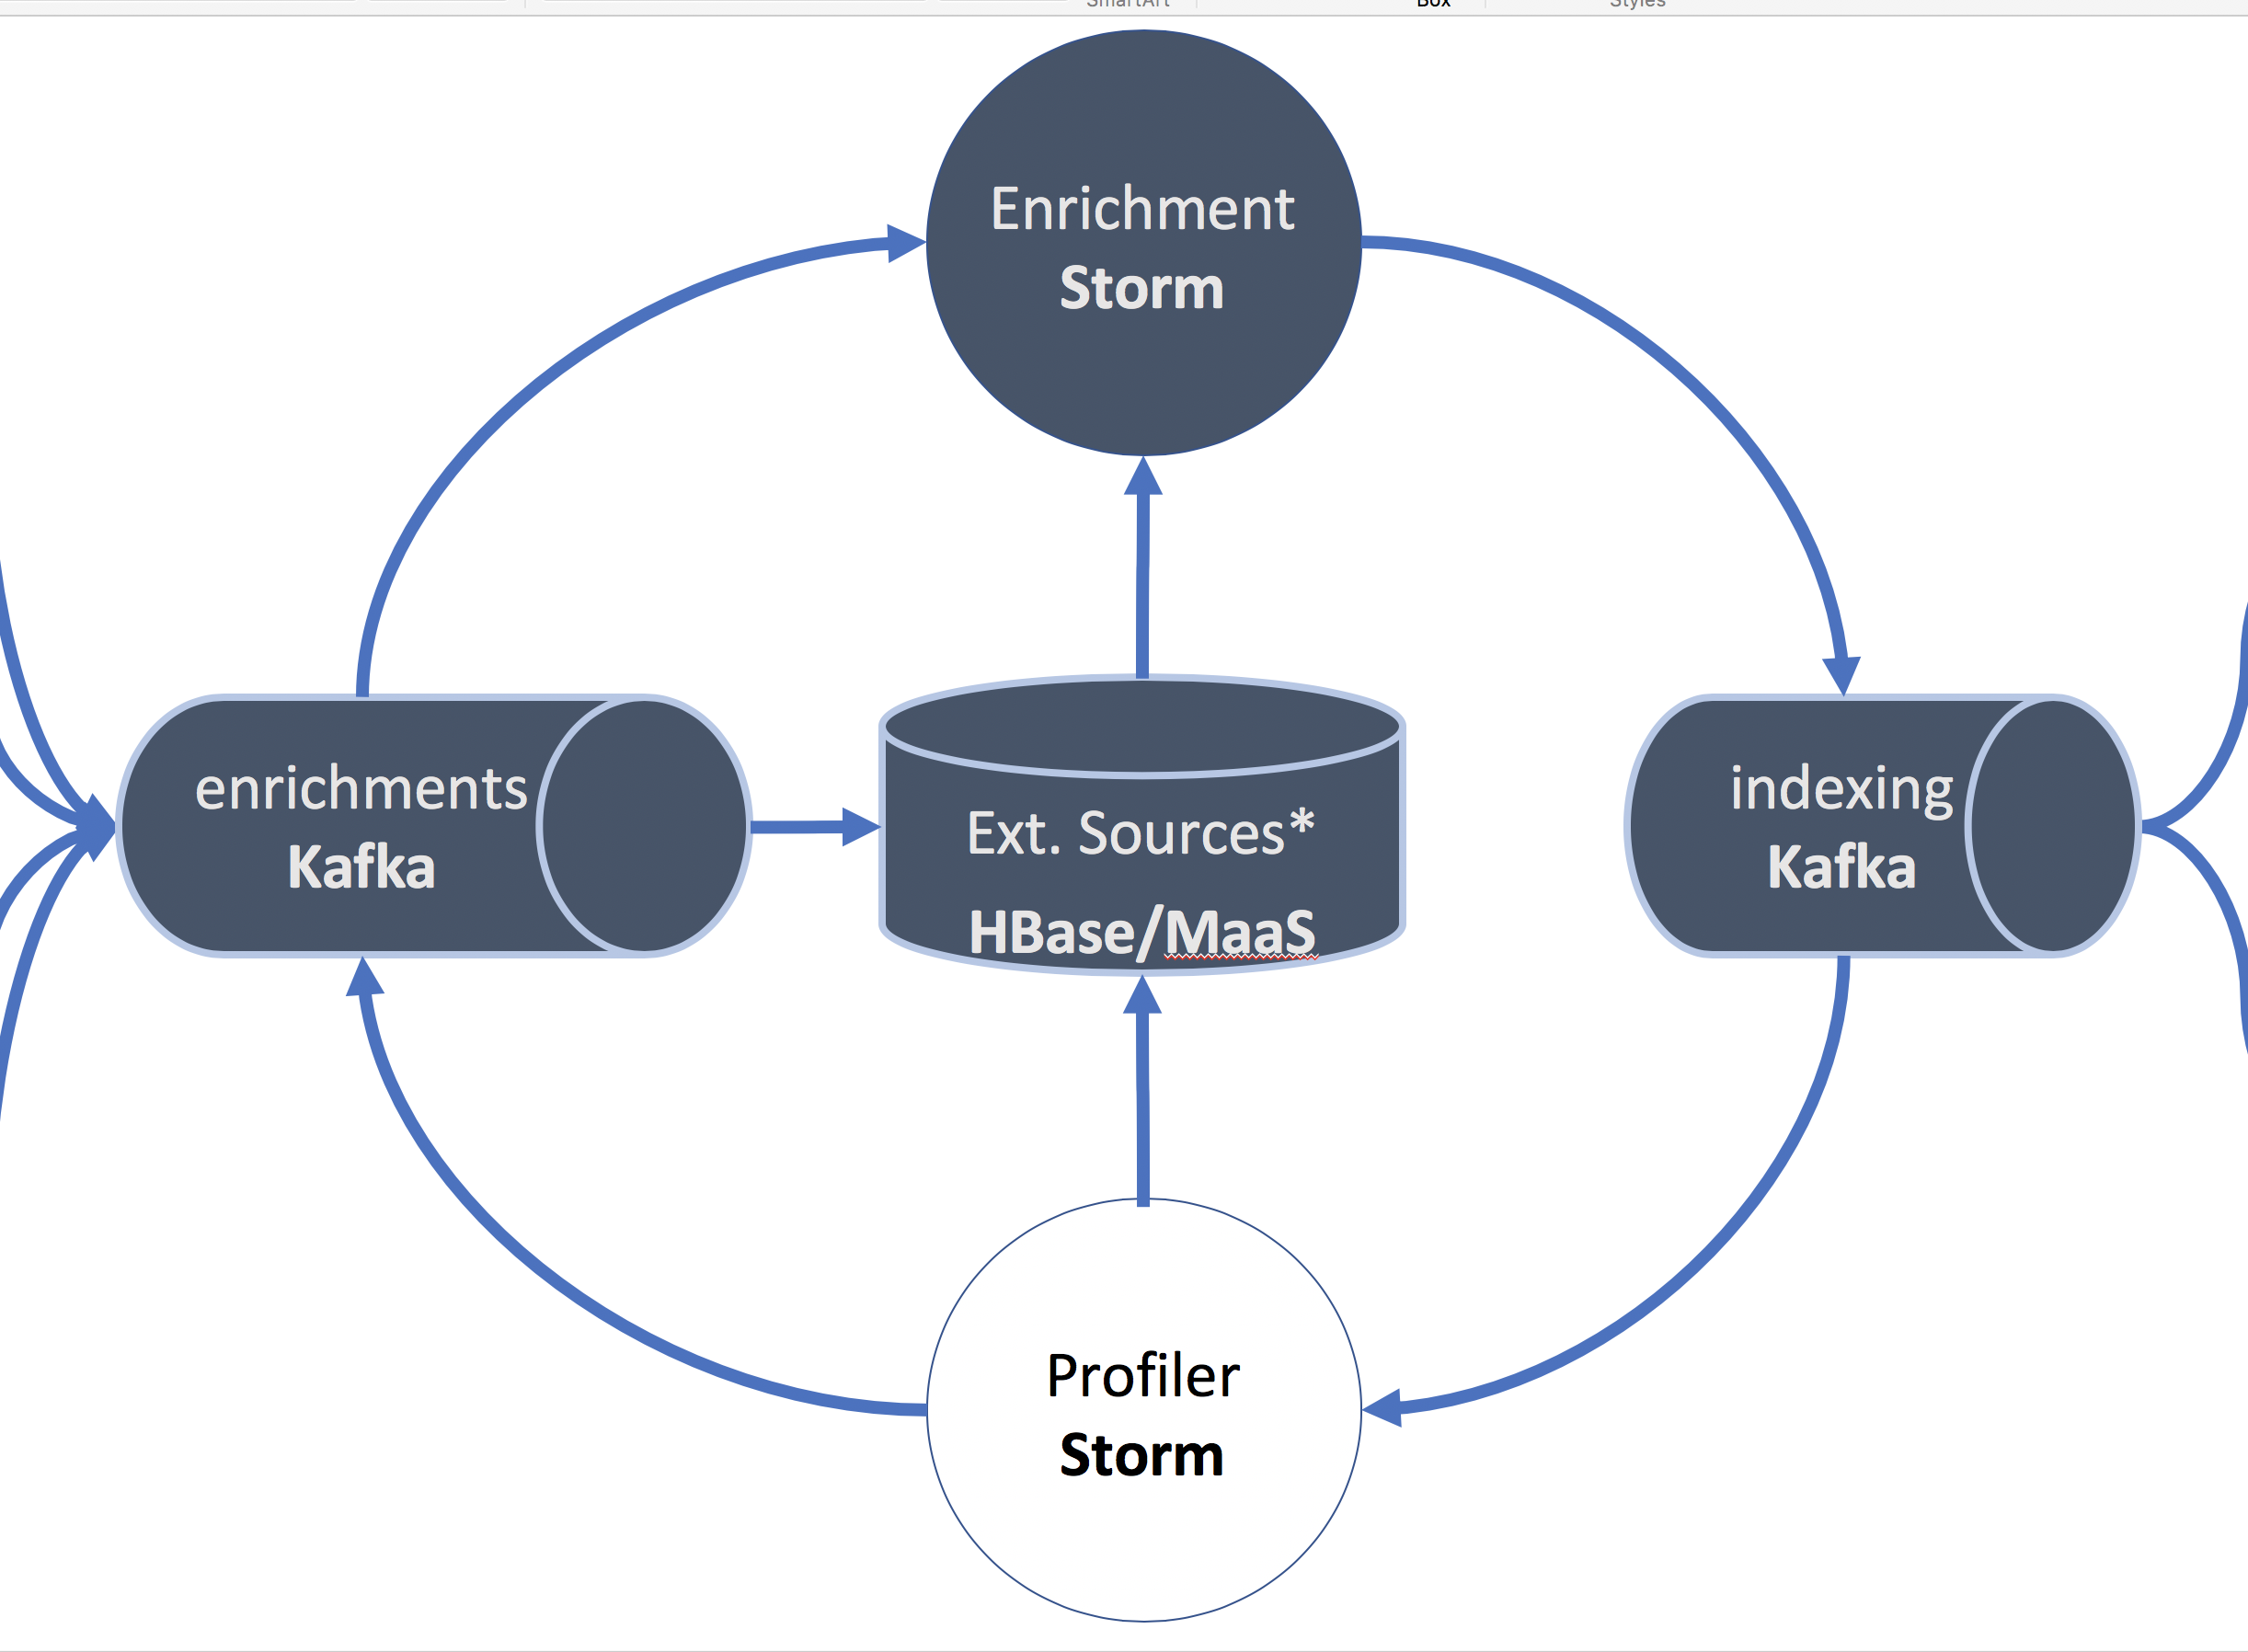
I added a few more details into the figure on the enrichment part:
The enrichment Storm topology is capable of using external database sources on-boarded into HBase or from the Model as a Service (MaaS) capability.
The arrow from the enrichments Kafka topic is not entirely correct, but should depict that data sources coming in in real-time can be stored in HBase as an enrichment source. Correct would be to draw the arrow to HBase directly from the parser topology.
Huge data sets can be fairly easily batch loaded into HBase as an enrichment source.
The profiler is a Storm topology that saves data of certain (user-defined) entities in a time series to HBase. From there it can be used as an enrichment for any future events as aggregates over time.
Open Source Cyber Security with Apache Metron @ Openslava2018
Apache Metron aims to be a tool for analysts in a cyber security team to help them defining intelligent alerts, detecting threats and work on them in real-time. This is the first blog post in a row to ease operations and share my experiences with Apache Metron. Thus, it serves as an introduction to Metron.
Technical Introduction
Apache Metron is a cyber security platform making heavy use of the Hadoop Ecosystem to create a scalable and available solution. It utilizes Apache Storm and Apache Kafka to parse, enrich, profile, and eventually index data from telemetry sources, such as network traffic, firewall logs, or application logs in real-time. Apache Solr or Elastic Search are used for random access searches, while Apache Hadoop HDFS is used for long term and analytical storage. It comes with its own scripting language “Stellar” to query, transform and enrich data. A security operator/analyst uses the Metron Management UI to configure and manage input sources as well the Metron Alerts UI to search, filter and group events.
Metron Alerts UI, showing a few dummy events from a Squid log.
Scope of this Post
Since virtually every data source can be used to generate events, it is natural that the platform operator/analyst wants to add data from new sources over time. I use this post as a small check list, to document considerations for the “onboarding” process of new data sources. You might want to automate this process in a way that works for you. In future posts I will cover the steps in detail.
Onboard a New Data Source
I need to ingest data to Kafka
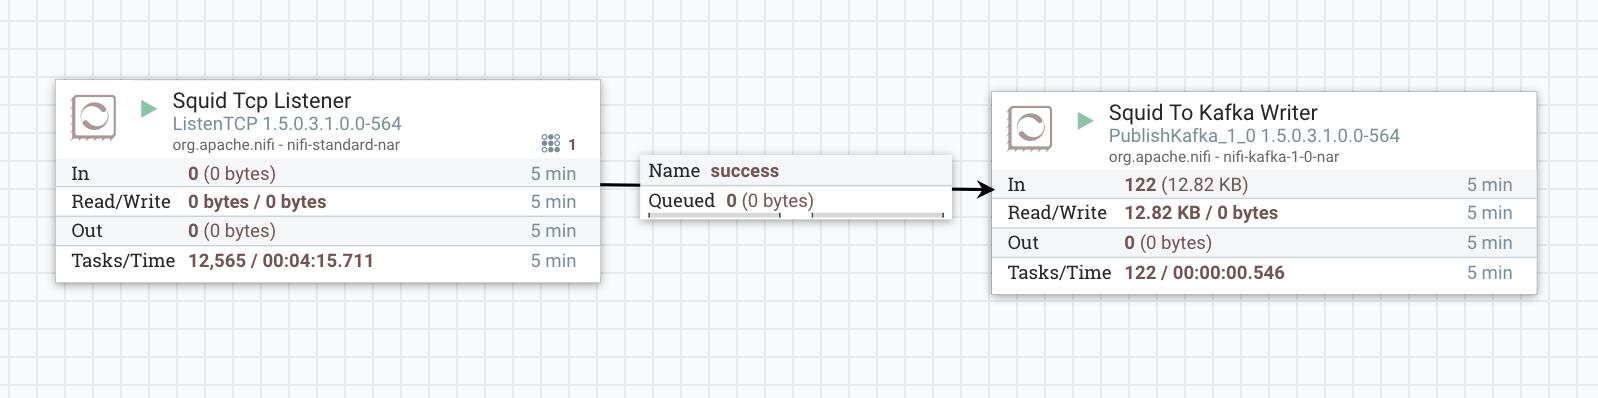
It’s very handy to use Apache NiFi for the ingest part. Just create a data flow consisting of two processors: a simple tcplistener to receive data and a Kafka producer to push the event further into Kafka.
I can also push data directly into Kafka if the architecture, firewall and the source system allow it.
If there are no active components on the source system pushing data, I might want to install an instance of MiNiFi on my source system.
Simple example of a data ingest into Kafka via NiFi
Before I can ingest data into Kafka, I need a new Kafka topic
While the Kafka topics “enrichments” and “indexing” Kafka topics will be used by all data sources, the parser topics are specific to a data source.
I create a topic named “squid” with a number of partitions that corresponds to the amounts of data I receive.
To make the events searchable, i.e., to store the events into Apache Solr, I need to create a new Solr collection (or Elastic Search template)
For each parser Storm topology and parser Kafka topic, there is a parser Solr collection.
I add a few specific fields common to all Metron Solr collections and optionally define data source specific fields in the schema.xml.
I create a new collection named “squid” with a number of shards that corresponds to the amount of data I receive.
I define my parser in the Metron Management UI
I click the “+” button in the right bottom corner of the Metron Management UI.
I configure my parser by choosing a Java class and/or define a Grok pattern, insert a sample and check if the parsed output is what I expect.
I configure the parser: Kafka topic name, Solr collection name, parser config, enrichment defintions, threat intel logic, transformations, parallelism.
I save the parser configuration and press the “Play” button next to the new parser to start it.
Metron Management UI with my configured parsers. Currently only the Squid parser is running that produces the events in the first screenshot.
Outlook
I hope this post was helpful and informative. For questions I refer to the documentation, future posts, the Metron mailing list or post a question below.