In one of my previous articles I wrote about Apache Metron as an Example for a Real-Time Streaming Pipeline. Since then, I’ve refined the figure I’ve used to explain the architecture. In this article, I just briefly explain the updated part of the figure and add a video of myself talking about Apache Metron at the Openslava conference in Bratislava using those updated figures in my slides.
Enrichment
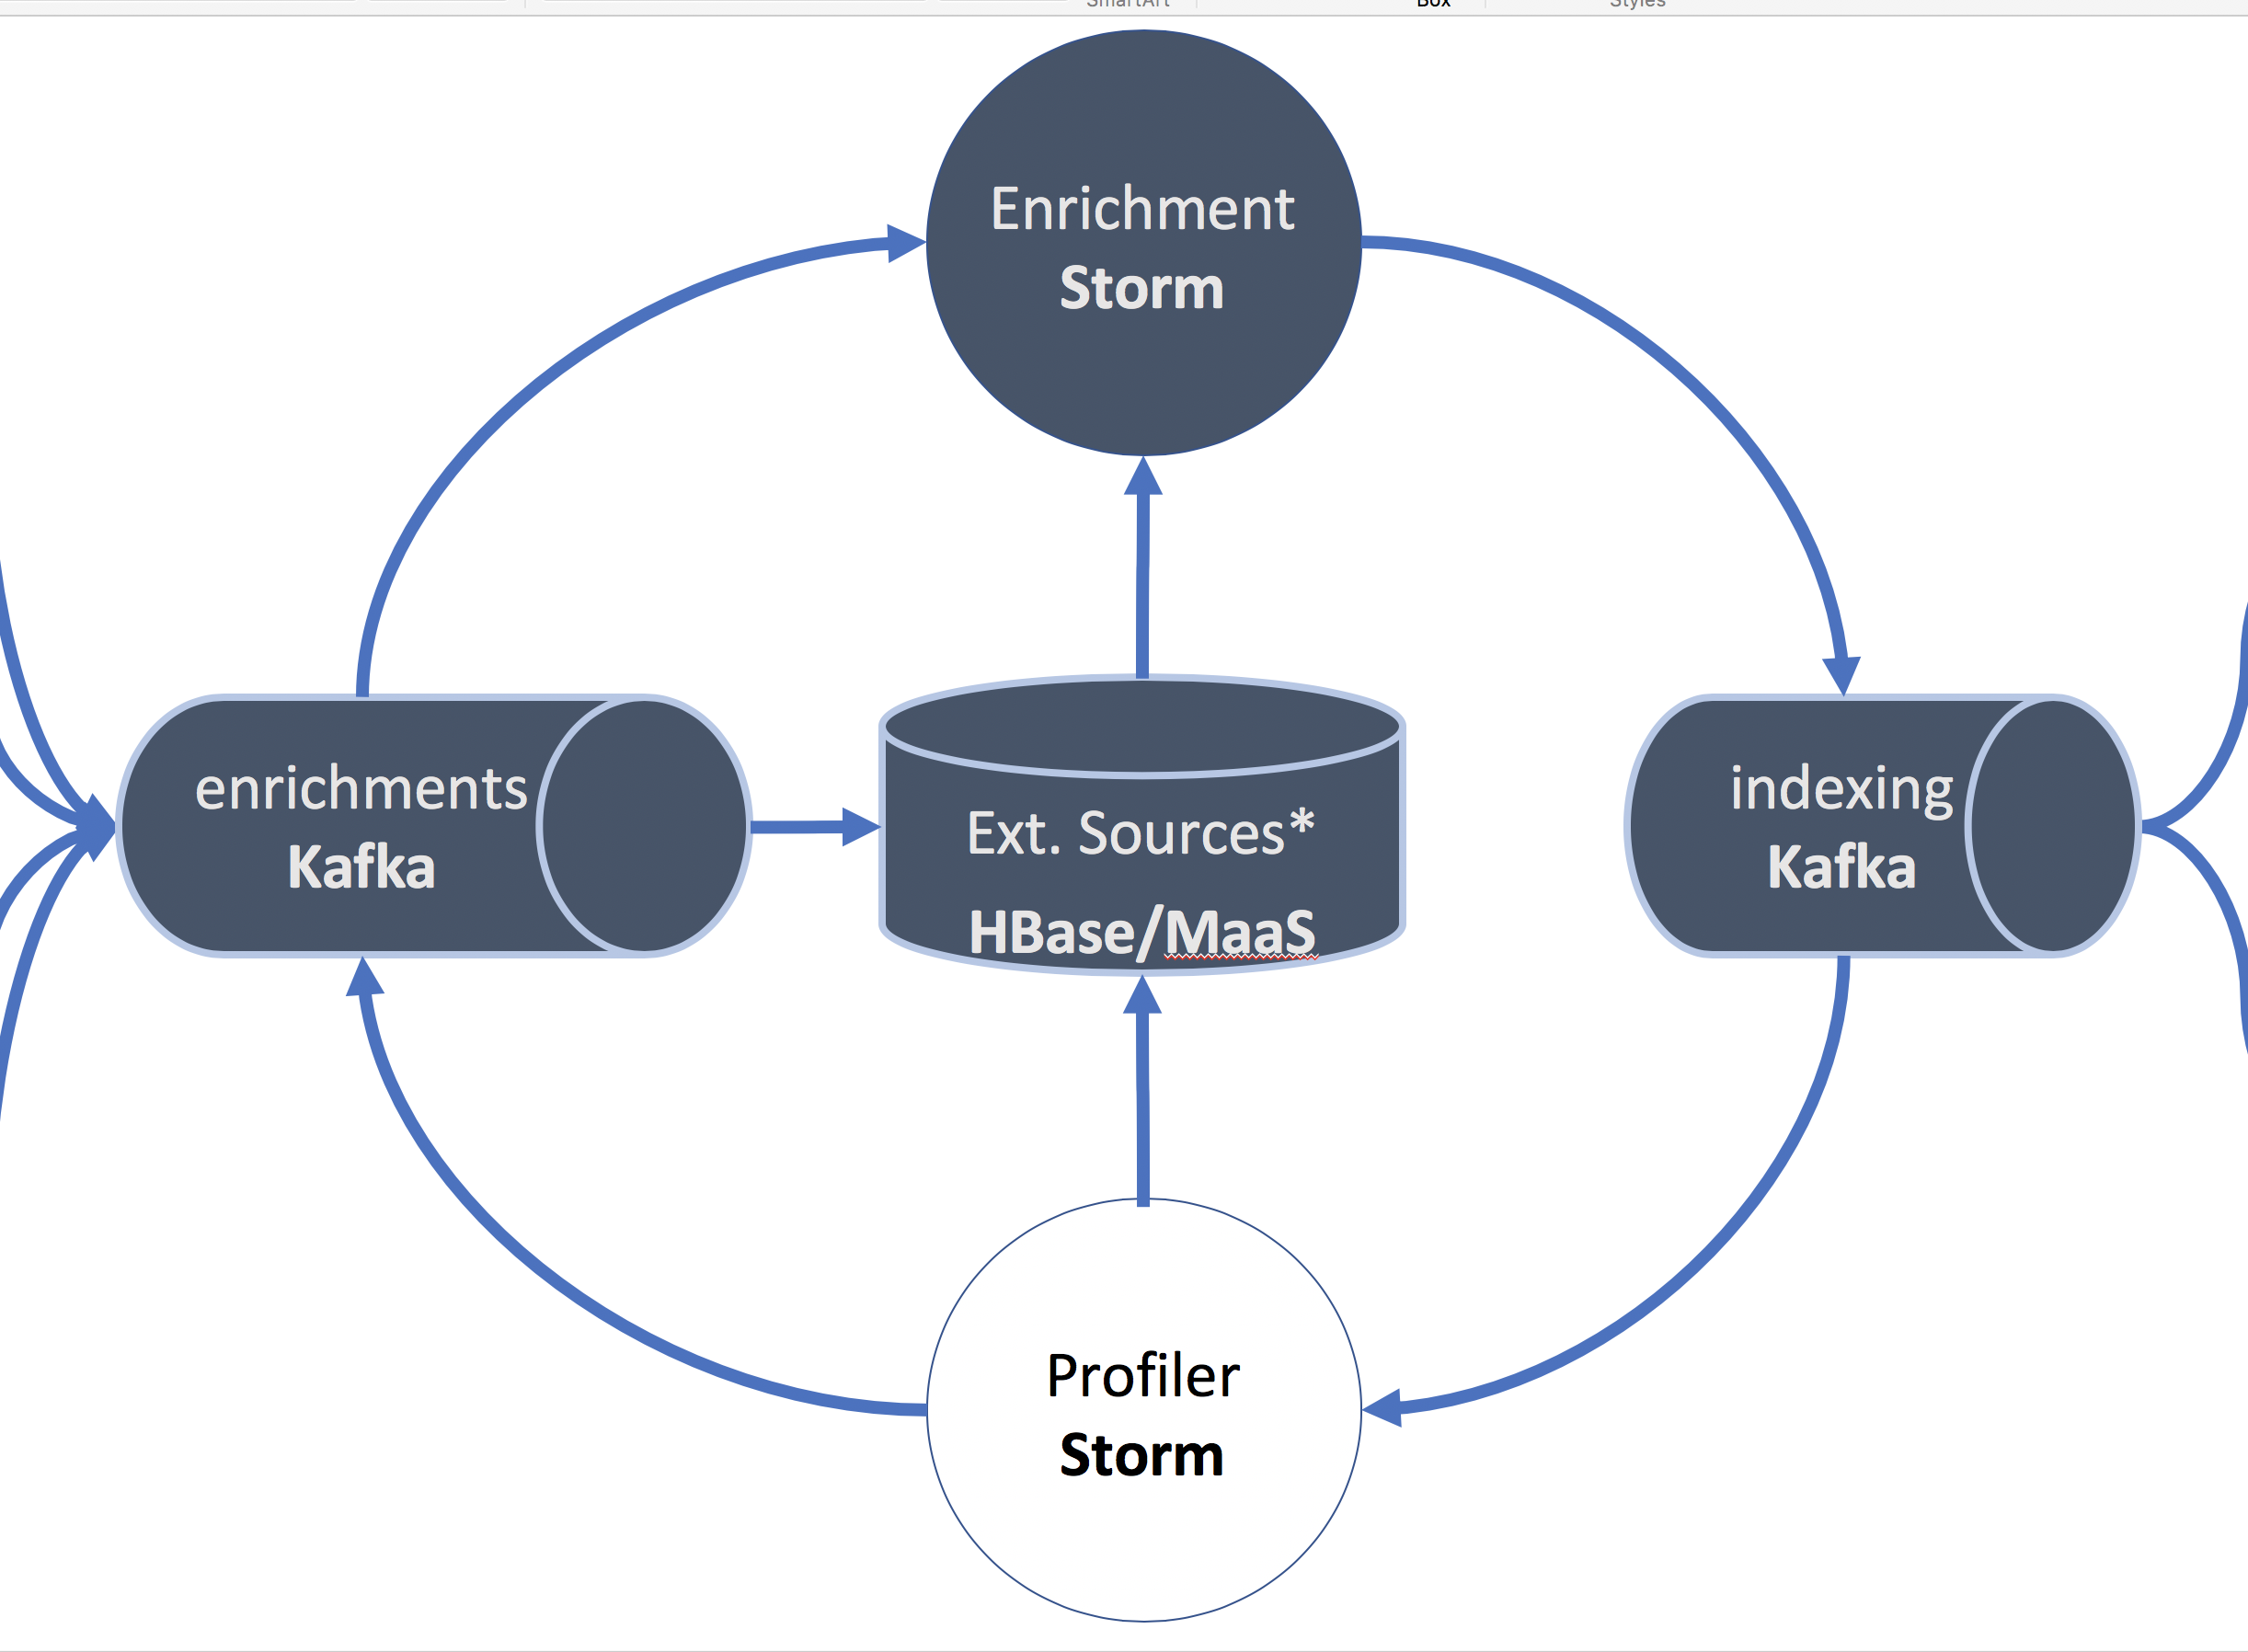
I added a few more details into the figure on the enrichment part:
The enrichment Storm topology is capable of using external database sources on-boarded into HBase or from the Model as a Service (MaaS) capability.
The arrow from the enrichments Kafka topic is not entirely correct, but should depict that data sources coming in in real-time can be stored in HBase as an enrichment source. Correct would be to draw the arrow to HBase directly from the parser topology.
Huge data sets can be fairly easily batch loaded into HBase as an enrichment source.
The profiler is a Storm topology that saves data of certain (user-defined) entities in a time series to HBase. From there it can be used as an enrichment for any future events as aggregates over time.
Open Source Cyber Security with Apache Metron @ Openslava2018
When you onboard a new data source on Apache Metron and you use Elastic Search (ES) as your indexing + search engine you need to specify and submit an ES template before the indexing topology attempts the first write to the ES cluster.
The template should contain the following items:
Dynamic fields for possible geo enrichments of any ip address field,
dynamic fields for other kinds of enrichments
well defined static fields (“properties”) based on the fields that are unique to this parser.
As found in the official Metron docs: The metron_alert field type needs to be nested. As per the documentation, if you forget to do this, you’ll run into this Exception:
QueryParsingException[[nested] failed to find nested object under path [metron_alert]];
curl -X POST $ELASTICSEARCH_MASTER/_template/squid_index -d @template.json
Step 4: Check if template was created correctly
curl -X GET $ELASTICSEARCH_MASTER/_template | python -m json.tool
You can find a basic, fully working squid template here.
Troubleshooting
If you query a collection via the Kibana Metron UI and see an error similar to the following exception in the Elastic Search Master log, your template is either not valid or the index is not using it.
Caused by: java.lang.IllegalArgumentException: Fielddata is disabled on text fields by default. Set fielddata=true on [source:type] in order to load fielddata in memory by uninverting the inverted index. Note that this can however use significant memory. Alternatively use a keyword field instead.
Thus, after you created the template and after you ingested your first events via the random access indexing topology, you want to check if your (rollover) index was created with the correct template:
# check if our squid index is there:
curl -X GET $ELASTICSEARCH_MASTER/_cat/indices
## example output:
## yellow open squid_index_2018.11.26.23 l7BO0FflRg6H0op3fM5wkw 5 1  5  0  48.3kb  48.3kb
## yellow open .kibana                   sEGp3YyZSXu40A1nRv1umQ 1 1 46 41 207.4kb 207.4kb

# check in the logs if there is a line that specifies which template was used when the index was created:
tail -f /var/log/elasticsearch/metron.log
## example output:
## ...
## [2018-11-26T23:13:58,395][INFO][o.e.c.m.MetaDataCreateIndexService][condla0.field.hortonworks.com] [squid_index_2018.11.26.23] creating index, cause [auto(bulk api)], templates [squid_index], shards [5]/[1], mappings [squid_doc]
## ...
Important Things to Note
/var/log/elasticsearch/metron.log is the most important log file for debugging ES template related actions
If you want to make your new data source available in Kibana, don’t forget to add the index pattern – in our case "squid_index_*":
This blog entry goes through the process of a Cyber Platform Operator creating a new parser for Apache Metron and everything you need to consider to make this process as smooth as possible. This can also be seen as a checklist or to-do list when you are creating a new parser.
Assumption: You know what Metron is, the data source is fully onboarded on your platform and the parser config is the only thing that’s missing. Here are the things you need to consider to onboard a new source.
In general, this article walks you through 3 phases:
Check if you can re-use an existing parser. If so, you’re done, the testing part of phase 2 still applies, though.
Build and test a protoype. Grok is your friend.
Write your parser in Java.
Phase 1: Check if you can use an existing parser
Get a sample set of your source to test with. The more diverse you expect the formats of the same source to be, the bigger your sample size should be. 20 should be ok to start with.
Check the format of the string.
If it is in JSON format, use the JSON parser!
If it’s a comma separated line, use the CSV parser!
Or generally: If it’s in a format of any of the included Metron parsers, use this parser: CEF, Lancope, PaloAltoFirewall, Sourcefire, Logstash, FireEye, Asa, Snort, JSONMap, Ise, GrokWebSphere, Bro,….
If it’s something else use the Grok parser!
Phase 2: Build and test a (Grok) prototype
In the rest of the article I assume that you don’t re-use one of the included parsers, which is why you want to create your own custom one. Thus, you leverage the Grok parser. However, the test setup described below and can be used for any kind of parser.
Test all of your samples in the app to check if your Grok statement is general enough.
You also might want to append %{GREEDYDATA:suffix}(\n|\r|\r\n)?+ to catch any kind of additional data, as well as filter newline and optional carriage-return fields at the end of a line. That depends on how diverse or clean your data source is.
Configure and validate the parser in Metron Management UI using “Grok” as parser type and paste the grok statement in the field “Grok Statement”.
Attention: don’t forget to define the timestampField, the timeFields and the dateFormat. If you don’t specify those values, the parser validation will fail with an “error_type”: “parser_invalid”. The field configured as the timestampField will be converted into a timestamp parsed based on the inputs from the dateFormat field. Use the Joda time date format documented here.
When the datetime is correctly parsed, double-check if the calculated timestamp matches the input time. This online epochconverter comes handy.
Note: to consolidate your view of the data across many sources, make sure you name the source ip address “ip_src_addr”, your destination ip address “ip_dst_addr”, your source port “ip_src_port” and your destination port “ip_dst_port”.
Note: In general, every parser – not only the Grok parser – has their specific required/default parameters to be set. Read the parser docs to be sure to configure the parsers correctly. Below is an example of how the parserConfig part of your parser configuration file should look like. You configure this part in the Metron Management UI:
Double check:
If Grok statements are stored in the configured HDFS path: /apps/metron/patterns/mycustomparser
If the Zookeeper configuration is up to date: bin/zkCli.sh -server <zookeeper-quorum> get /metron/topology/parsers/mycustomparser. Specifically look for the parserConfig part shown below.
Metron parser test setup: 1. Consume from the parser topic (assuming you initially ingested your sample already) 2. Control your flow rate to release only 1 event per 5 seconds (or which ever speed you like) 3. Write back into the parser topic and check if the event is being processed correctly.
Ingest the messages into the Kafka topic using your NiFi test setup and check if they are successfully persisted in your desired collection.
Phase 3: Make your Metron parser production ready
Once you have your custom parser up and running and improved it continuously you want to create something more stable with higher performance than Grok statements. However, nothing is for free. You need to get your hands dirty in Java. Fortunately, it’s not a lot of dirt and it’s quite easy to write your own parser by extending the BasicParser class.
Check out this part of the documentation to get a walkthrough: 3rd party parsers
In this part of the documentation you’ll learn to:
Get to know which dependencies you need.
Implement a parser method of your custom parser class extending the BasicParser class.
Build the jar and deploy it in the extra-parser directory.
Restart Metron Rest service to pick up the new parser from your jar file.
Add your parser in the Metron Management UI by choosing your parser type.
Configure and start your parser.
Stop your interim Grok parser and start your custom Java parser.
Now I want to shine some light on how the ingestion pipeline architecture looks like. Since I just got started with Apache Metron myself, I hope this helps to kickstart your cyber security efforts. Rather than going too much into the details of what the components do, I’d like to provide a basic overview about which components there are.
This architecture can be generalized for all kinds of streaming use cases. The pipeline uses Apache NiFi for ingest, Apache Kafka as an event buffer, Apache Storm for stream processing, Apache Hadoop for long term storage and Apache Solr for short term random access storage. If you design your own pipeline for a different use case, you can, e.g., swap Apache Storm with frameworks such as Apache Flink or Spark Streaming (or any other frameworks out in the wild with their pros and cons). Choosing the right piece of technology strongly depends on numerous factors, I’m not going into in this article.
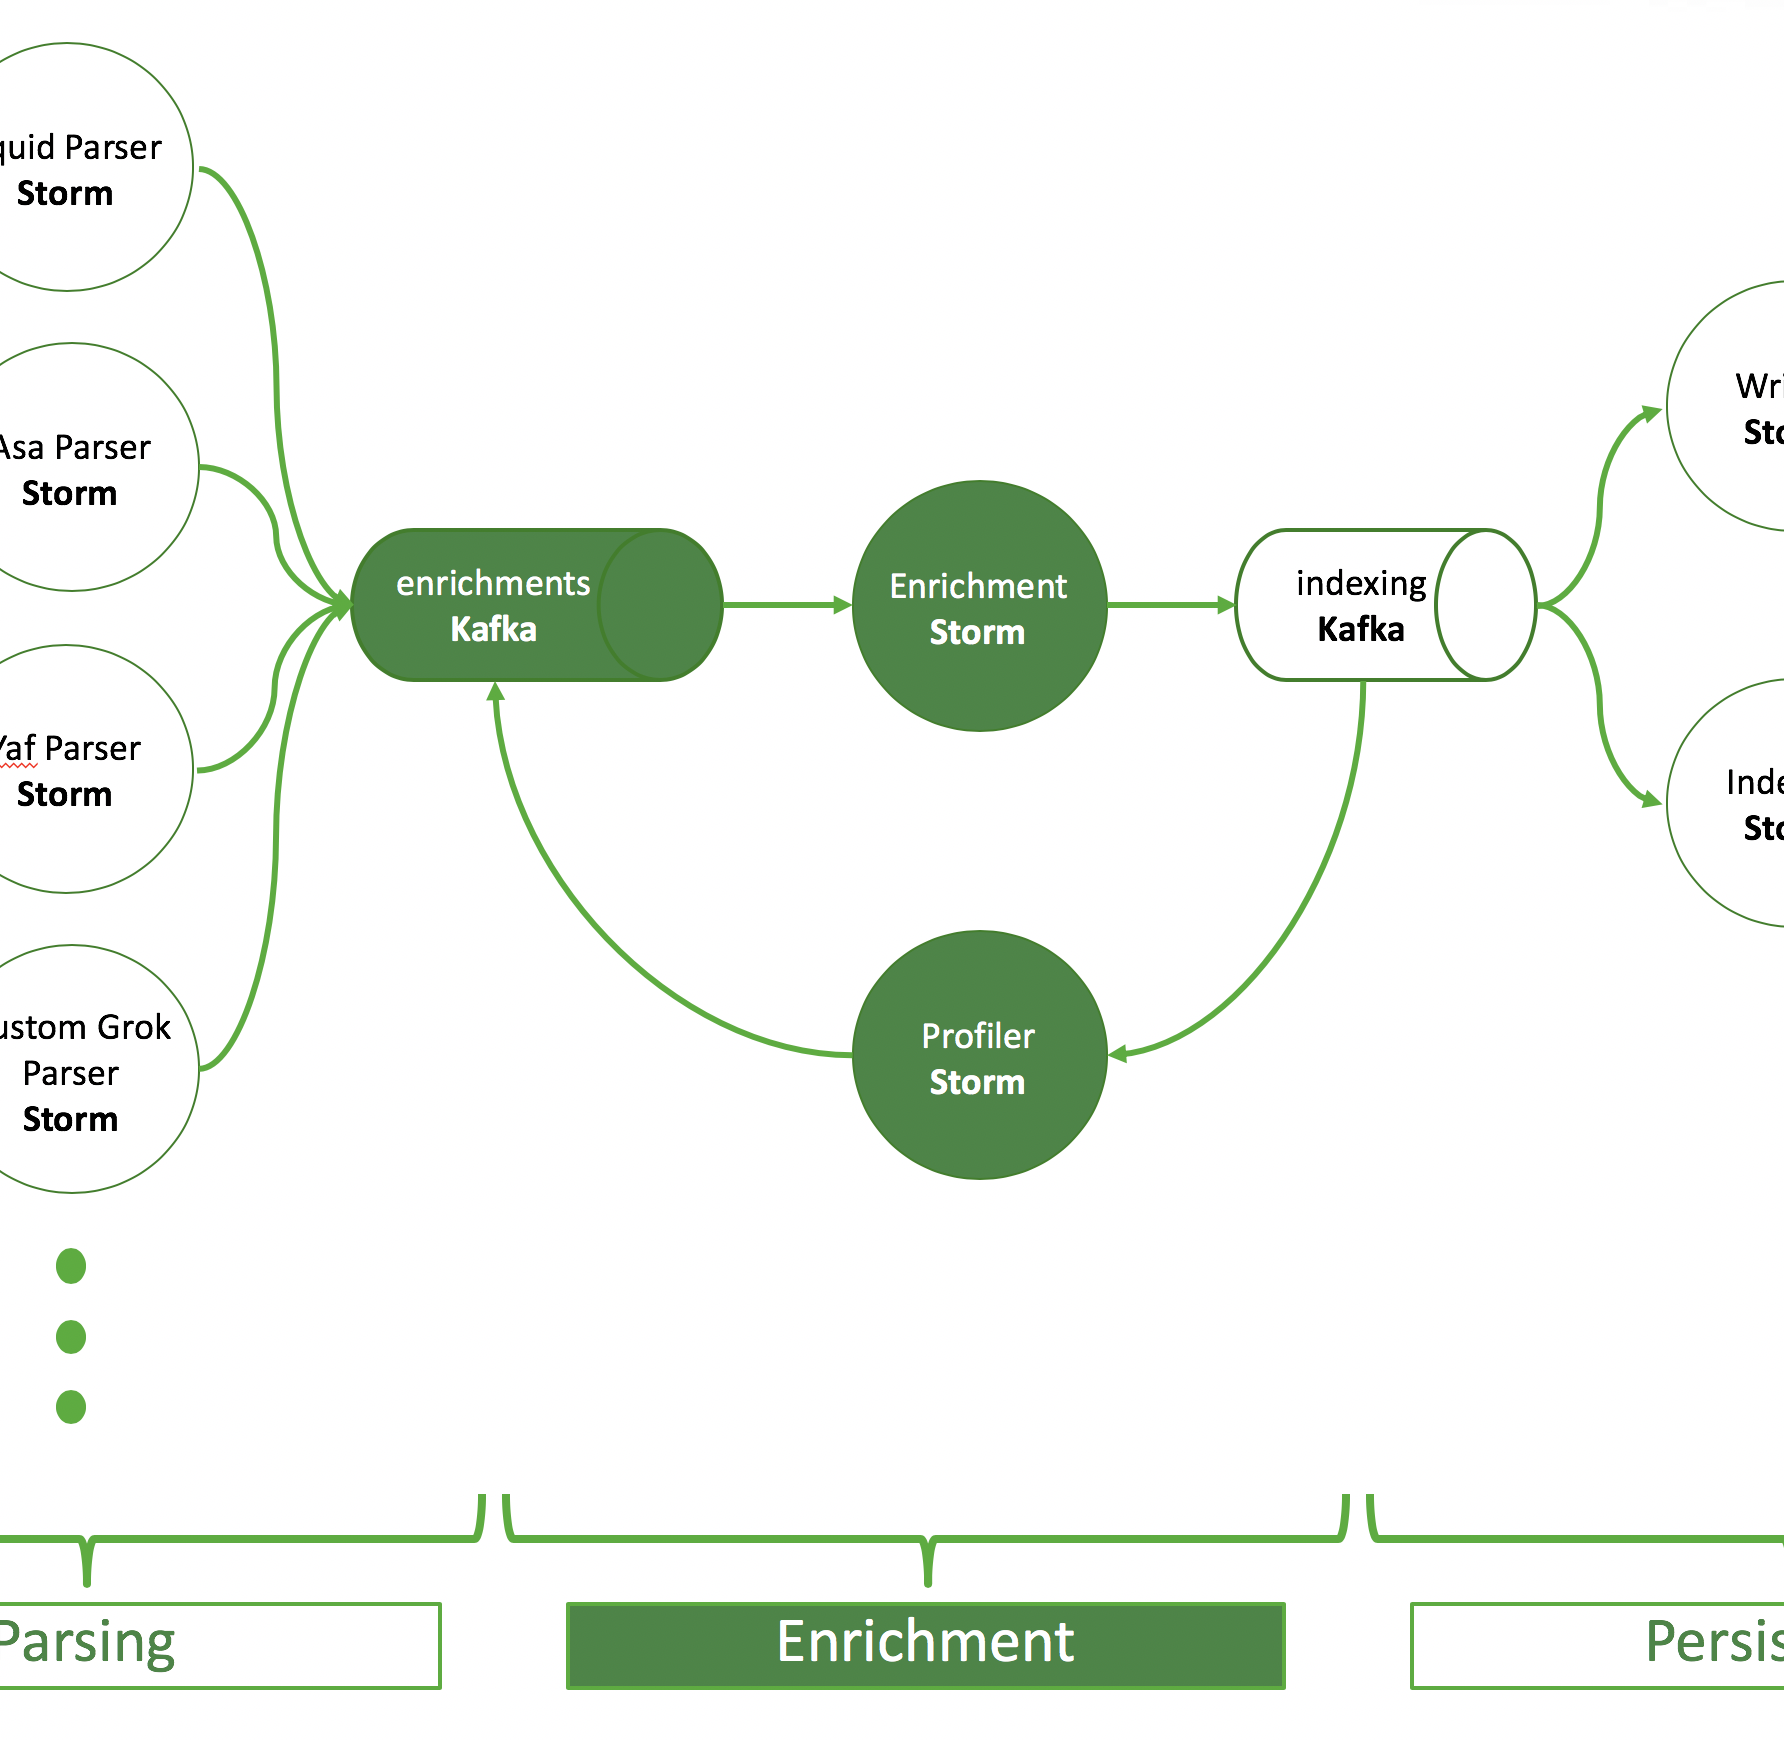
End to End Processing Pipeline for Apache Metron
Ingest
The most important part for Apache Metron is to get the telemetry data into an Apache Kafka topic. In the figure below you can see that there is a Kafka topic and a corresponding parser for each format. Usually, there is one Kafka topic per source type, because each source typically comes in its own special format, but it’s also possible that data of one source has multiple formats or multiple sources have the same format.
Apache NiFi is being used as the data integration tool.
In the figure, I added an example of a MiNiFi instance to the Squid Access Log source. In this case MiNiFi is installed on the Squid server node and acts as a log forwarder.
It’s also possible that sources write directly into Kafka, if they support that. In some cases this might even be a requirement due to performance constraints.
Parsing
As described in the ingest part: there is a topic for each parser format and an Apache Storm topology reading from this Kafka topic and doing the parsing. A parsed event is then written into the so-called “enrichments” topic.
The parsing has two purposes:
it brings all ingest format into a JSON format.
it introduces a common set of fields shared among all data sources, as well as unique fields that are special to each source.
Some parsers of common formats are included in the Metron project.
If there is no parser (that works) for your format, you can use Grok to quickly prototype and launch your parser before you write it in Java.
It is also possible to launch parser chains to extract information that is convoluted in different formats.
You can also decide to run only one topology handling multiple parsers in a so-called aggregated parser. This can be combined with parser chains.
Enrichment
The purpose of the enrichment Storm topology is to pick up events from the enrichments topic and add information from external sources. The enriched output is written to an indexing topic.
A typical enrichment is a lookup in a database to convert an IP address into geo information
The profiler uses sliding windows to create aggregates/statistics in certain time windows, so-called profiles.
These profiles can be used to enrich data.
Metron helps you use any data in HBase to enrich your events.
Persisting
There are two Storm topologies to read from the indexing topic that persist events, the batch indexing topology and the random access indexing topology. The first utilizes an HDFSBolt to write data to HDFS. The latter one indexes data in Apache Solr.
There is one Solr collection per data format.
This way the parsed fields and definitions are kept clean and separated.
Also, you can authorize different users and groups to different data sources. This is even easier with the Solr Plugin for Apache Ranger.
HDFS is used as long term storage for analytical purposes and to use the data to create machine learning models.
Solr is being used for direct fast random access and search capabilities, e.g. by the Metron Alerts UI. It makes sense to store the data for only a limited amount of time for performance reasons.
It’s quite easy to create a new collection. I’ve described it on this github gist. I’ve added properties in the solrconfig.xml to define a “time to live” for an event in Solr, after which the event will be deleted from the collection.
Instead of Solr, you can use Elastic Search.
Conclusion
I hope this can be useful for somebody, either trying to implement Metron or somebody interested in how modern streaming pipelines look like in general. If you have questions, don’t hesitate to ask the experts in the Metron mailing list (user@metron.apache.org) or get support from the Hortonworks Community.
Apache Metron aims to be a tool for analysts in a cyber security team to help them defining intelligent alerts, detecting threats and work on them in real-time. This is the first blog post in a row to ease operations and share my experiences with Apache Metron. Thus, it serves as an introduction to Metron.
Technical Introduction
Apache Metron is a cyber security platform making heavy use of the Hadoop Ecosystem to create a scalable and available solution. It utilizes Apache Storm and Apache Kafka to parse, enrich, profile, and eventually index data from telemetry sources, such as network traffic, firewall logs, or application logs in real-time. Apache Solr or Elastic Search are used for random access searches, while Apache Hadoop HDFS is used for long term and analytical storage. It comes with its own scripting language “Stellar” to query, transform and enrich data. A security operator/analyst uses the Metron Management UI to configure and manage input sources as well the Metron Alerts UI to search, filter and group events.
Metron Alerts UI, showing a few dummy events from a Squid log.
Scope of this Post
Since virtually every data source can be used to generate events, it is natural that the platform operator/analyst wants to add data from new sources over time. I use this post as a small check list, to document considerations for the “onboarding” process of new data sources. You might want to automate this process in a way that works for you. In future posts I will cover the steps in detail.
Onboard a New Data Source
I need to ingest data to Kafka
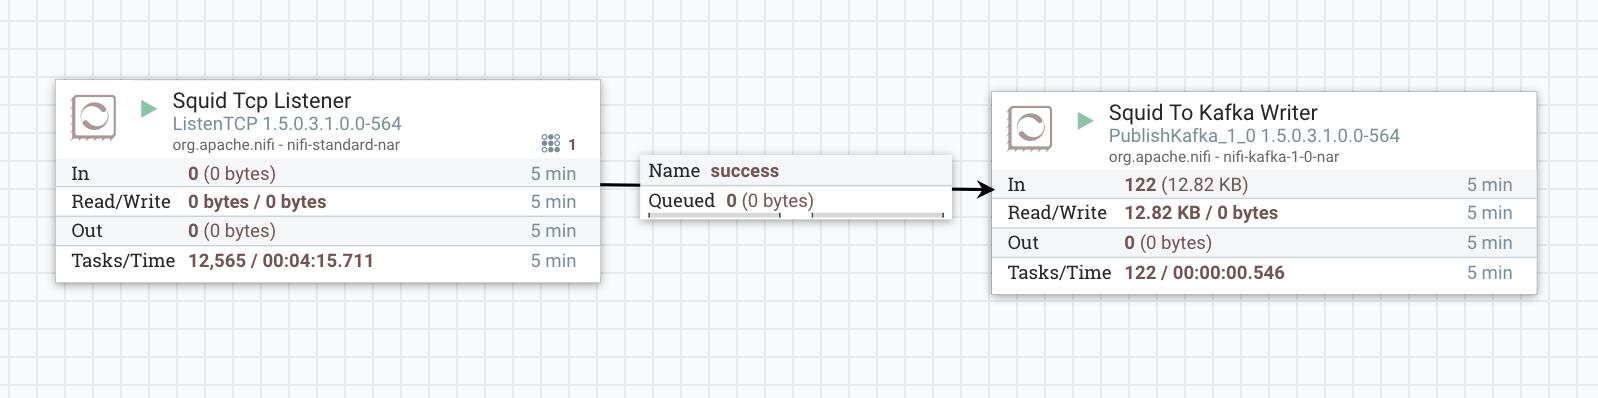
It’s very handy to use Apache NiFi for the ingest part. Just create a data flow consisting of two processors: a simple tcplistener to receive data and a Kafka producer to push the event further into Kafka.
I can also push data directly into Kafka if the architecture, firewall and the source system allow it.
If there are no active components on the source system pushing data, I might want to install an instance of MiNiFi on my source system.
Simple example of a data ingest into Kafka via NiFi
Before I can ingest data into Kafka, I need a new Kafka topic
While the Kafka topics “enrichments” and “indexing” Kafka topics will be used by all data sources, the parser topics are specific to a data source.
I create a topic named “squid” with a number of partitions that corresponds to the amounts of data I receive.
To make the events searchable, i.e., to store the events into Apache Solr, I need to create a new Solr collection (or Elastic Search template)
For each parser Storm topology and parser Kafka topic, there is a parser Solr collection.
I add a few specific fields common to all Metron Solr collections and optionally define data source specific fields in the schema.xml.
I create a new collection named “squid” with a number of shards that corresponds to the amount of data I receive.
I define my parser in the Metron Management UI
I click the “+” button in the right bottom corner of the Metron Management UI.
I configure my parser by choosing a Java class and/or define a Grok pattern, insert a sample and check if the parsed output is what I expect.
I configure the parser: Kafka topic name, Solr collection name, parser config, enrichment defintions, threat intel logic, transformations, parallelism.
I save the parser configuration and press the “Play” button next to the new parser to start it.
Metron Management UI with my configured parsers. Currently only the Squid parser is running that produces the events in the first screenshot.
Outlook
I hope this post was helpful and informative. For questions I refer to the documentation, future posts, the Metron mailing list or post a question below.
Apache Storm is a real-time, fault-tolerant, event-based streaming framework and platform that runs your code in a highly parallelized way on distributed nodes. It’s all about Spouts (processing units to read from data sources) and Bolts (general processing units). Storm is often used to read data from Apache Kafka and write the results back to Kafka or to a data store. Apache Storm and Apache Kafka are the work horses of the cyber security platform Apache Metron. Storm is also being used internally by the Streaming Analytics Manager (SAM)
This article guides you through the debugging process and points you to the places you need to tweak your configuration to get your topology up and running in a kerberized environment in case certain errors occur. For basic information on how to authenticate your application check out the reference implementation by Pierre Villard on his Github page.
Prerequisites
I assume that you start from a certain point:
Your Storm cluster and the services you communicate with (Kafka, Zookeeper, HBase) is up and running as well as secure, i.e., the authentication happens through the Kerberos protocol.
Your Storm cluster is configured to run topologies as the OS user corresponding to the Kerberos principal who submitted the topology. (See: “Run worker processes as user who submitted the topology” in the excellent article of the Storm documentation)
Your topology (written in Java) is ready to be deployed and authentication is put in place.
Debugging Process
Use the Storm UI to check if the topology’s workers are throwing any errors and on which machine they are running! The worker’s log files are stored on the machine the worker is running in /var/log/storm/workers-artifacts/<topology-name><unique-id>/<port-number>/worker.log.
Check the input data and output data of your Storm topology. In case you are using Kafka, connect via the Kafka console consumer and read from the input and the output topic of your topology! If you don’t see any events in the input Kafka topic, you should check upstream for errors. If you do see input events, but no output events, refer to your topology logs described in the item above. If you do see output events, check if they have the expected format (data format, number and kind of fields are correct, fields contain data that makes sense as opposed to null values)
# List Kafka topics:
bin/kafka-topics.sh --zookeeper <zookeeper.hostname>:<zookeeper.port> --list

# print messages as they are written on stdout from input topic
bin/kafka-console-consumer.sh --bootstrap-server <kafka.broker.hostname>:<kafka.broker.port> --topic input

# print messages as they are written on stdout from output topic
bin/kafka-console-consumer.sh --bootstrap-server <kafka.broker.hostname>:<kafka.broker.port> --topic output
Possible Error Scenarios
Authentication Errors Exception
Caused by: javax.security.auth.login.LoginException: Could not login: the client is being asked for a password, but the Kafka client code does not currently support obtaining a password from the user. not available to garner authentication information from the user
Your topology is being submitted and the supervisor tries to start and initialize the Spouts and Bolts in the worker process based on the configuration you provided. When this error occurs the worker process is killed and the supervisor tries to spawn a new worker process. On the machine the worker is supposed to run, you can see a worker process popping up with a certain PID (ps aux | grep <topology_name>). A few seconds later this process is killed and a process exactly as the old one is started with a different PID. You can also tail the worker log and see this error message. Soon afterwards the “Worker has died” message appears. This can happen for various reasons:
The OS user running the topology does not have the permission to read the keytabs configured in the jaas config file. Check with ps auxor top which user is running and check if the keytab has the correct POSIX attributes. Usually it should be read-only by the owning user (-r– — — <topology-user><topology-user>)
The jaas configuration points to the wrong keytabs to be used for authentication and the OS user does not have permission to those. Check with ps aux which jaas file is configured. You might find an option there. Check if this jaas config file has the desired authentication options configured. If not configure your own and pass it to the topology.
Hadoop is old, everyone has their own Hadoop cluster and everyone knows how to use it. It’s 2018, right? This article is just a collection of a few gotchas, dos and don’ts with respect to User Management that shouldn’t happen in 2018 anymore.
Terminology
Just a few terms and definitions so that everyone is on the same page for the rest of the article. Roll your eyes and skip that section if you are an advanced user.
OS user = user that is provisioned on the operating system level of the nodes of a Hadoop cluster. You can check if the user exists on OS level by doing
id username
KDC = Key Distribution Center. This might be a standalone KDC implementation, such as the MIT KDC or an integrated one behind a Microsoft Active Directory.
Keytab = file that stores the encrypted password of a user provisioned in a KDC. Can be used to authenticate without the need of typing the password using the “kinit” command line tool.
Do
Make sure your users are available on all nodes of the OS, as well as in the KDC. This is important for several reasons:
When you run a job, the job might create staging/temporary directories in the /tmp/ directory, which are owned by the user running the job. The name of the directory is the name of the OS user, while the ownership belongs to authenticated user. In a secure cluster the authenticated user is the user you obtained a Kerberos ticket for from the KDC.
Keytabs on OS level should be only readable by the user OS user who is supposed to authenticate with them for security purposes.
When impersonation is turned on for services, e.g., Oozie using the -doas tag, Hive using the property hive.server2.enable.doAs=True property or Storm using the supervisor.run.worker.as.user=true property, a user authenticated as a principal will run on the OS level as a processs owned by that user. If that user is not known to the OS, the job will fail (to start).
Don’t
Don’t use the hdfs user to run jobs on YARN (it’s forbidden by default and don’t change that configuration). Your problem can be solved in a different way! Only use the hdfs user for administrative tasks on the command line.
Don’t run Hive jobs as the “hive” user. The “hive” user is the administrative user and if at all should only be used by the Hadoop/database administrator.
Or in general: Don’t use the <service name> user to do <operation> on <service name>. You saw that coming, hm?
How to Achieve Synchronisation of KDC and OS Level
(…or other user/group management systems). This is a tricky one, if you don’t want to run into a split brain situation, where one system knows one set of users and another one knows others, which may or may not overlap.
Automate user provisioning, e.g., by using an Ansible role that provisions a user in the KDC and on all nodes of the Hadoop cluster.
Use services such as SSSD (System Security Services Daemon) that integrates users and groups from user and group management services into the operating system. So you won’t need to actually add them to each node, as long as SSSD is up and running.
Manually create OS users on all nodes and in the KDC (don’t do that, obviously ;P )
Factorio is a computer game. You probably ask yourself, in which ways a computer game is related to this blog? Well, not at all – or is it? Let’s find out.
Basically, in the game you take over the role of a character in 3rd person perspective, whose rocket ship crashed on a foreign planet. You don’t have anything, but a pick axe in the beginning. Your goal is to repair your rocket ship to go home safely. In the course of the game you’ll go from picking resources manually and crafting items manually to building mines, creating items in factories and connecting them using conveyor belts. Later on you even built your own power plants, electric networks and trains. The game is not forcing you to automate everything, but if you didn’t you probably wouldn’t reach your goal in this lifetime. In the game’s “About” section you can find how this goal is supposed to be achieved:
You will be mining resources, researching technologies, building infrastructure, automating production and fighting enemies. Use your imagination to design your factory, combine simple elements into ingenious structures, apply management skills to keep it working and finally protect it from the creatures who don’t really like you.
Does that sound familiar to you? No? – Then read it again and think about it as if it were a very honest job description for an engineering role in a large corporation which just started to “explore” Agile and DevOps methodologies. This is when I started to think about analogies between the game and IT projects.
What the game taught me about IT automation
A lot of those points feel super logical just writing them down, and not even worth mentioning, but then again, why don’t companies start acting on them?
You can only succeed if you keep automating processes, automate those processes that save you the most time at the moment and keep automating what you automated and combine automated processes.
You can’t completely avoid doing and fixing things manually, nor should you. There’s always the aliens living on the planet* destroying your infrastructure and pipelines. In the beginning before you build repair robots, you need to do a lot of manual repair work. Also, keep in mind to not automate everything. Keep doing things manually that don’t actually justify the time you spend automating processes at that certain point of time. You may want to automate those processes later on, but focus on the important (= most repetitive and time-consuming) ones first. *Think about those aliens as an analogy to either software bugs or users or to colleagues who don’t want to move away from waterfall methodology. 😛
If you are not the only one working on a project you need to talk to each other and continuously update each other on your (changing) plans. You need to define interfaces and locations where your infrastructure and processes can interact with the infrastructure and processes of your co-workers.
You can only succeed if you tear down a working implementation to build something more stable and scalable, even if it means that you will invest lots of resources and time. That doesn’t mean that you shouldn’t have built that piece of infrastructure at all. And it also doesn’t mean that the new piece of infrastructure will be there forever.
I’m not sure myself anymore if I am talking about the game or real-life IT. Thus, it seems to be a working analogy. If you know both the game and real-life DevOps methodologies go ahead and post a comment if you can think about something that is missing in my list above.
This analogy is interesting enough to start checking out more analogies of the game. I’ll create one or two future blog posts on those analogies, such as multi-threading and databases.
Apache Knox is a gateway application and the door to access data in a data lake hidden behind a firewall. While the usage is fairly simple the setup, configuration and debugging process can be tedious due to many different components that Apache Knox ties together. I published this article also on Hortonworks Community Connection.
Common Security Architecture Using Apache Knox for Data Access
Start Small
First try to access the service directly before you go over Knox. In many cases, there’s nothing wrong with your Knox setup, but with either the way you setup and configured the service behind Knox or the way you try to access that service.
When you are familiar on how to access your service directly and when you have verified that it works as intended, try to do the same call on Knox.
Example:
You want to check if webhdfs is reachable so you first verify directly at the service and try to get the home directory of the service.
Note: Direct access of WebHDFS and access of WebHDFS over Knox use two different authentication mechanisms: The first one uses SPNEGO which requires a valid Kerberos TGT in a secure cluster, if you don’t want to receive a “401 – Unauthorized” response. The latter one uses HTTP basic authentication against an LDAP, which is why you need to provide username and password on the command line.
Note 2: For the sake of completeness, I mention that here: Obviously, you direct the first request directly to the service host and port, while you direct your second request to the Knox host and port and specify which service.
The next section answers the question, what to do if the second command fails? (If the first command fails, go setup your service correctly and return later).
Security Related Issues
So what do the HTTP response codes mean for a Knox application? Where to start?
Authentication Issues
Very common are “401 – Unauthorized”. This can be misleading, since 401 is always tied to authentication – not authorization. That means you need to probably check one of the following items. Which of these items causes the error can be found in the knox log (per default /var/log/knox/gateway.log)
Is your username password combination correct (LDAP)?
Is your username password combination in the LDAP you used?
Is your LDAP server running?
Is your LDAP configuration in the Knox topology correct (hostname, port, binduser, binduser password,…)?
Is your LDAP controller accessible through the firewall (ports 389 or 636 open from the Knox host)?
Note: Currently (in HDP 2.6), you can specify an alias for the binduser password. Make sure, that this alias is all lowercase. Otherwise you will get a 401 response as well.
Authorization Issues
If you got past the 401s, a popular response code is “403 – Unauthorized”. Now this has actually really something to do with authorization. Depending on if you use ACL authorization or Ranger Authorization (which is recommended) you go ahead differently. If you use ACLs, make sure that the user/group is authorized in your topology definition. If you use Ranger, check the Ranger audit log dashboard and you will immediately notice two possible error sources: Your user/group is not allowed to use Knox. Your user/group is not allowed to use the service that you want to access behind Knox. Well, we came a long way and with respect to security we are almost done. One possible problem you could become is with impersonation. You need knox to be allowed to impersonate any user who access a service with knox. This is a configuration in core-site.xml: hadoop.proxyuser.knox.groups and hadoop.proxyuser.knox.hosts. Enter a comma separated list of groups and hosts that should be able to access a service over knox or set a wildcard *. This is what you get in the Knox log, when your Ranger Admin server is not running and policies cannot be refreshed.
2017-07-05 21:11:53,700 ERROR util.PolicyRefresher (PolicyRefresher.java:loadPolicyfromPolicyAdmin(288)) - PolicyRefresher(serviceName=condlahdp_knox): failed to refresh policies. Will continue to use last known version of policies (3) javax.ws.rs.ProcessingException: java.net.ConnectException: Connection refused (Connection refused)
This is also a nice example of Ranger’s design to not interfere with services if it’s down: policies will not be refreshed, but are still able operate as intended with the set of policies before Ranger crashed.
Application Specific Issues
Once you are past the authentication and authorization issues, there might be issues with how Knox interacts with its applications. This section might grow with time. If you have more examples of application specific issues, leave a comment or send me an email.
Hive
To enable Hive working with Knox, you need to change the transport mode from binary to http. It might be necessary in rare cases to not only restart Hiveserver2 after this configuration change, but also the Knox gateway.
This is what you get when you don’t switch the transport mode from “binary” to “http”. Binary runs on port 10000, http runs on port 10001. When binary transport mode is still active Knox will try to connect to port 10001 which is not available and thus fails with “Connection refused”.
2017-07-05 08:24:31,508 WARN hadoop.gateway (DefaultDispatch.java:executeOutboundRequest(146)) - Connection exception dispatching request: http://condla0.field.hortonworks.com:10001/cliservice?doAs=user org.apache.http.conn.HttpHostConnectException: Connect to condla0.field.hortonworks.com:10001 [condla0.field.hortonworks.com/172.26.201.30] failed: Connection refused (Connection refused) org.apache.http.conn.HttpHostConnectException: Connect to condla0.field.hortonworks.com:10001 [condla0.field.hortonworks.com/172.26.201.30] failed: Connection refused (Connection refused) at org.apache.http.impl.conn.DefaultHttpClientConnectionOperator.connect(DefaultHttpClientConnectionOperator.java:151) at org.apache.http.impl.conn.PoolingHttpClientConnectionManager.connect(PoolingHttpClientConnectionManager.java:353)
When you fixed all possible HTTP 401 errors for other services than Hive, but still get on in Hive, you might forget to pass username and password to beeline
$TRUSTSTORE_PATH is the path to the truststore containing the knox server certificate, on the server with root access you could e.g. use /usr/hdp/current/knox-server/data/security/keystores/gateway.jks
$KNOX_HOSTNAME is the hostname where the Knox instance is running
$KNOX_PORT is the port exposed by Knox
$TRUSTSTORE_SECRET is the secret you are using for your truststore
Now, this is what you get, when you connect via beeline trying to talk to Knox from a different (e.g. internal) hostname than the one configured in the ssl certificate of the server. Just change the hostname and everything will work fine. While this error is not specifically Hive related, you will most of the time encounter it in combination with Hive, since most of the other services don’t require you to check your certificates.
Connecting to jdbc:hive2://knoxserver-internal.field.hortonworks.com:8443/;ssl=true;sslTrustStore=truststore.jks;trustStorePassword=myPassword;transportMode=http;httpPath=gateway/default/hive 17/07/06 12:13:37 [main]: ERROR jdbc.HiveConnection: Error opening session org.apache.thrift.transport.TTransportException: javax.net.ssl.SSLPeerUnverifiedException: Host name 'knoxserver-internal.field.hortonworks.com' does not match the certificate subject provided by the peer (CN=knoxserver.field.hortonworks.com, OU=Test, O=Hadoop, L=Test, ST=Test, C=US)
HBase
WEBHBASE is the service in a Knox topology to access HBase via the HBase REST server. Of course, a prerequisite is that the HBase REST server is up and running.
Even if it is up and running it can occur that you receive an Error with HTTP code 503. 503: Unavailable. This is not related to Knox. You can track down the issue to a HBase REST server related issue, in which the authenticated user does not have privileges to e.g. scan the data. Give the user the correct permissions to solve this error.
While security is a quite complex topic by itself, security of distributed systems can be overwhelming. Thus, I wrote down a state of the art article about Hadoop (Ecosystem) Security Concepts and also published it on Hortonworks Community Connection.
In the documentation of the particular security related open source projects you can find a number of details on how these components work on their own and which services they rely on. Since the projects are open source you can of course check out the source code for more information. Therefore, this article aims to summarise, rather than explain each process in detail.
In this article I am first going through some basic component descriptions to get an idea which services are in use. Then I explain the “security flow” from a user perspective (authentication –> impersonation (optional) –> authorization –> audit) and provide a short example using Knox.
When reading the article keep following figure in mind. It depicts all the process that I’ll explain.
Provides RESTful API and a UI to manage authorization policies and service access audits based on resources, users, groups and tags.
Ranger User sync:
Syncs users and groups from an LDAP source (OpenLDAP or AD)
Stores users and groups in the relational DB of the Ranger service.
Ranger Plugins:
Service side plugin, that syncs policies from Ranger per default every 30 seconds. That way authorization is possible even if Ranger Admin does not run in HA mode and is currently down.
Ranger Tag Sync:
Syncs tags from Atlas meta data server
Stores tags in the relational DB of the Ranger service.
Ranger Key Management Service (KMS):
Provides a RESTful API to manage encryption keys used for encrypting data at rest in HDFS.
Supporting relational Database:
Contains all policies, synced users, groups, tags
Supporting Apache Solr instances:
Audits are stored here.
Documentation:
For the newest HDP release (2.6.0) use these Ranger Docs
Knox serves as a gateway and proxy for Hadoop services and their UIs so that they can be accessible behind a firewall without requiring to open too many ports in the firewall.
Documentation:
For the newest HDP release (2.6.0) use these Knox Docs
Active Directory
Components:
Authentication Server (AS)
Responsible for issuing Ticket Granting Tickets (TGT)
Ticket Granting Server (TGS)
Responsible for issuing service tickets
Key Distribution Center (KDC)
Talks with clients using KRB5 protocol
AS + TGS
LDAP Server
Contains user and group information and talks with its clients using the LDAP protocol.
Supporting Database
Wire Encryption Concepts
To complete the picture I just want to mention that it is very important, to not only secure the access of services, but also encrypt data transferred between services.
Keystores and Truststores
To enable a secure connection (SSL) between a server and a client, first an encryption key needs to be created. The server uses it to encrypt any communication. The key is securely stored in a keystore for Java services JKS could be used. In order for a client to trust the server, one could export the key from the keystore and import it into a truststore, which is basically a keystore, containing keys of trusted services. In order to enable two-way SSL the same thing needs to be done on the client side. After creating a key in a keystore the client can access, put it into a trust store of the server. Commands to perform these actions are:
Generate key in "/path/to/keystore.jks" setting its alias to "myKeyAlias" and its password to "myKeyPassword". If the keystore file "/path/to/keystore.jks" does not exist, this will command will also create it.
Import key from a file “myKeyFile.cer” with alias “myKeyAlias” into a keystore (that may act as truststore) named “/path/to/truststore.jks” using the password “trustStorePassword”
Only a properly authenticated user (which can also be a service using another service) can communicate successfully with a kerberized Hadoop service. Missing the required authentication, in this case by proving the identity of both user and the service, any communication will fail. In a kerberized environment user authentication is provided via a ticket granting ticket (TGT).
Note: Not using KERBEROS, but SIMPLE authentication, which is set up by default, provides any user with the possibility to act as any other type of user, including the superuser. Therefore strong authentication using Kerberos is highly encouraged.
Technical Authentication Flow:
User requests TGT from AS. This is done automatically upon login or using the kinit command.
User receives TGT from AS.
User sends request to a kerberized service.
User gets service ticket from Ticket Granting Server. This is done automatically in the background when user sends a request to the service.
User sends service a request to the service using the service ticket.
Authentication Flow from a User Perspective:
Most of the above processes are hidden from the user. The only thing, the user needs to do before issuing a request from the service is to login on a machine and thereby receive a TGT or receive it programmatically or obtain it manually using the kinit command.
Impersonation
This is the second step after a user is successfully authenticated at a service. The user must be authenticated, but can then choose to perform the request to the service as another user. If everyone could do this by default, this would raise another security concern and the authentication process would be futile. Therefore this behaviour is forbidden by default for everyone and must be granted for individual users. It is used by proxy services like Apache Ambari, Apache Zeppelin or Apache Knox. Ambari, Zeppelin and Knox authenticate as “ambari”, “zeppelin”, “knox” users, respectively, at the service using their TGTs, but can choose to act on behalf of the person, who is logged in in the browser in Ambari, Zeppelin or Knox. This is why it is very important to secure these services.
To allow, for example, Ambari to perform operations as another user, set the following configs in the core-site.xml, hadoop.proxyuser.ambari.groups and hadoop.proxyuser.ambari.hosts, to a list of groups or hosts that are allowed to be impersonated or set a wildcard *.
Authorization
Authorization defines the permissions of individual users. After it is clear which user will be performing the request, i.e., the actually authenticated or the impersonated one, the service checks against the local Apache Ranger policies, if the request is allowed for this certain user. This is the last instance in the process. A user passing this step is eventually allowed to perform the requested action.
Audit
Every time the authorization instance is called, i.e., policies are checked if the action of a user is authorized or not, an audit event is being logged, containing, time, user, service, action, data set and success of the event. An event is not logged in Ranger in case a user without authentication tries to access data or if a user tries to impersonate another user, without having appropriate permissions to do so.
Example Security Flow Using Apache Knox
Looking at the figure above you can follow what’s going on in the background, when a user Eric wants to push a file into the HDFS service on path “/user/eric/” from outside the Hadoop cluster firewall.
User Eric sends the HDFS request including the file and the command to put that file into the desired directory, while authenticating successfully via LDAP provider at the Apache Knox gateway using his username/password combination. Eric does not need to obtain a Kerberos ticket. In fact, since he is outside the cluster, he probably does not have access to the KDC through the firewall to obtain one anyway.
Knox Ranger plugin checks, if Eric is allowed to use Knox. If he’s not, the process ends here. This event is logged in Ranger audits.
Knox has a valid TGT (and refreshes it before it becomes invalid), obtains a service ticket with it and authenticates at the HDFS namenode as user “knox”.
Knox asks the service to perform the action as Eric, which is configured to be allowed.
Ranger HDFS plugin checks, if Eric has the permission to “WRITE” to “/user/eric”. If he’s not, the process ends here. This event is logged in Ranger audits.
File is pushed to HDFS.
I hope this article helps to get a better understanding of the security concepts within the Hadoop Ecosystem.